With Oestersund coming to a close, it is time to review the Women’s individual performances and look at some athletes that stood out by their shooting and skiing performances based on the race data. It was nice to see that the wind that can be so typical for races in Oestersund mostly stayed away, giving us some tremendous races with fair conditions for all athletes!
The data and metrics
Based on IBU’s race data, the shooting charts shown in this article are simply expressed in the total shooting percentage (total misses divided by total shots taken). The skiing shown below uses the course time data and compares each athlete’s time with the fastest course time of the particular race. This gives us a “% behind the fastest skier” and gives us an idea of what an athlete must do to become the fastest skier of the pack.
Lisa Theresa Hauser
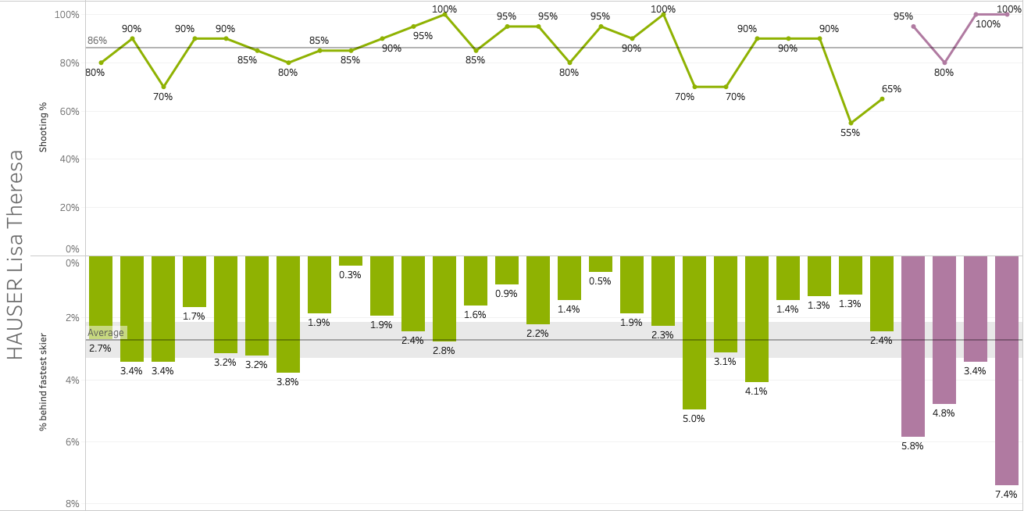
It is hard not to start with the current leader of the World Cup, and Hauser had some impressive races in Oestersund. And that with a ski speed that was slower (relative to the fastest skier) than her average based on the current and last season. Her shooting was top-notch and even above her already strong average of 86%. The chart below demonstrates these statistics per race event with the 2020-2021 season shown in green and the current 2021-2022 season shown in purple.
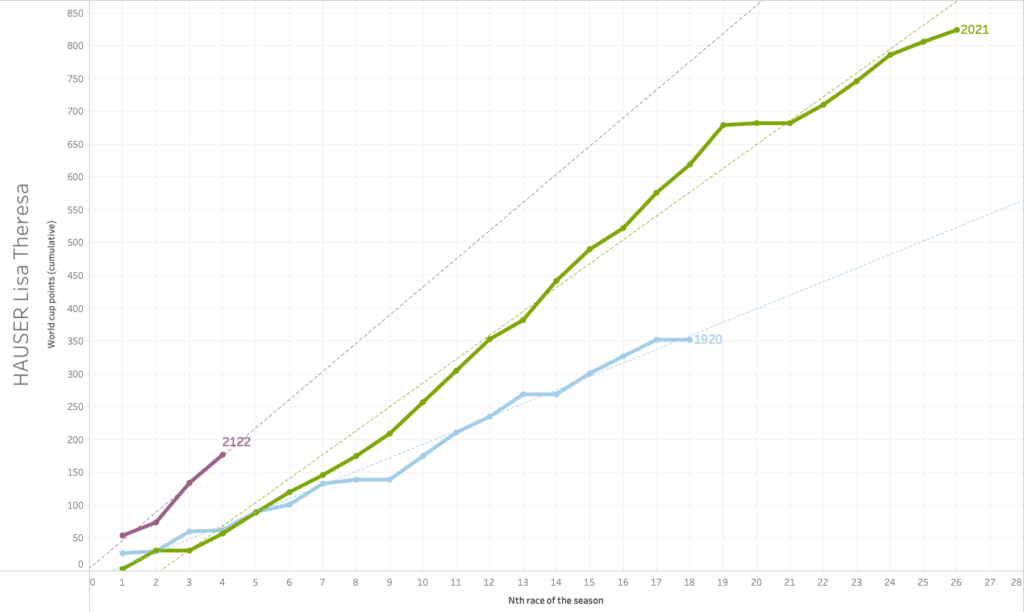
When we compare Hauser’s world cup points after four races to her previous two seasons’ four races, we can see that she is on a trend that will improve her final standing significantly if she can keep up this pace. It’s a bit early to say after only four races, but in any case, she is off to a great start of her season!
Anais Chevalier-Bouchet
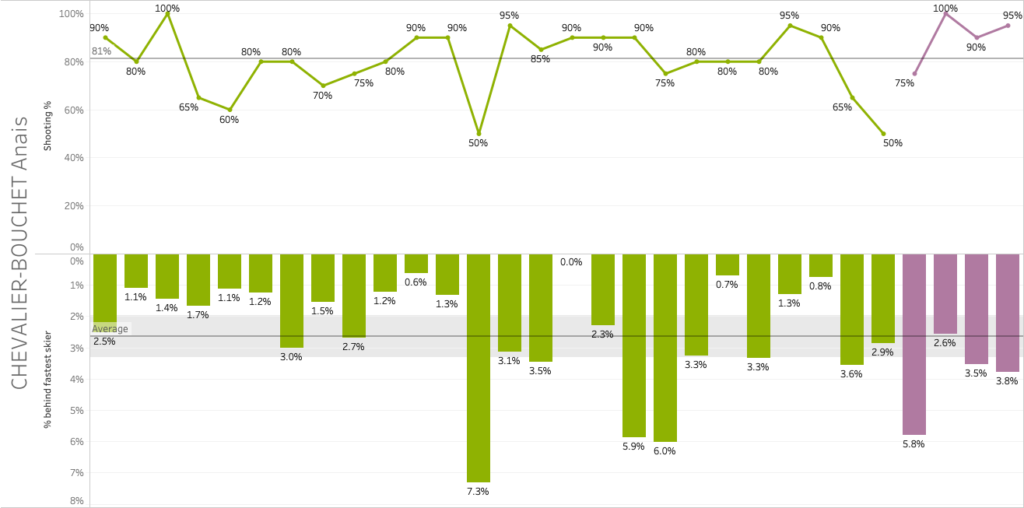
Although Chevalier-Bouchet had a similarly strong start in the past season, she surprised me somewhat with her strong performance in Oestersund. Perhaps this was based on her decline at the end of last season. Her first race seemed to continue that trend, but after that first race she had some great results, especially in the shooting range. Her skiing was around her average for the current and previous season, so if she can improve there I think she’ll be someone to keep an eye on this season.
Denise Herrmann
It is an understatement that Herrmann’s previous season was disappointing, but based on her races in Oestersund Herrmann seems to be on her way back. With excellent shooting for her and improving ski speed, can she regain her form with which she won the 2019-2020 world cup sprint globe? With her ski speed still being under her average of the previous and current season, an improvement can be expected there. And if she then can keep shooting the way she was in Oestersund, contention for top spots are definitely within reach for Herrmann.

Dzinara Alimbekava
Like with Hauser, Alimbekava is a safe bet with her third position in the current world cup rankings. But I was really impressed with her consistency at a high level during her races in Oestersund. And when looking at her world cup points for the current season and comparing them to last season, this shouldn’t be a surprise. If she can avoid fading away a little like last season she could be a contender for the overall title. As she is turning 26 in January the blue bib is no longer something she can battle for, but I’m sure she would pick the yellow bib over the blue if she has the chance.

Elvira Oeberg
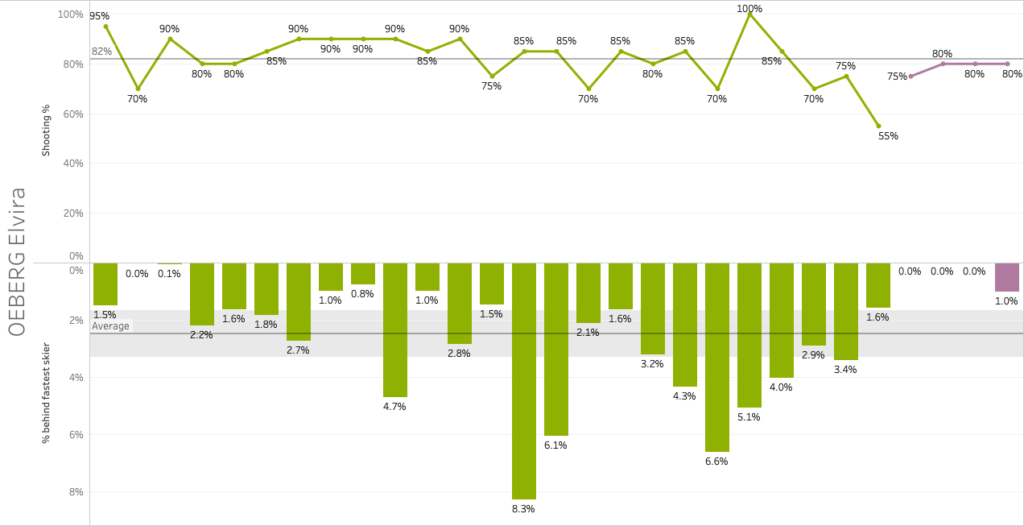
Lastly, the younger Oeberg sister was so impressive on her skis that I feel I cannot leave her out. Although her shooting was below her average from the current and last season, she made up many positions with her ski speed, being the fastest skier in three of the four races.
And currently in fourth place in the world cup rankings, she is right on pace with her season start last year. If she can improve on her shooting while keeping the speed it will be hard to imagine her out of the top five for upcoming races. Of course, this was a home event for Oeberg. And although that may come with some additional pressure, knowing the course really well and having a wax team that knows the conditions like no other team was a benefit she will no longer have in the rest of the season.

This concludes the women’s review of Oestersund. Part of this article was used in the IBU Biathlon Insider #2. If you are not yet subscribed to that, go to biathlonworld.com and scroll to the bottom then hit the Subscribe button! Or see the visuals “live” on my Tableau Public page. Or check my previous posts.