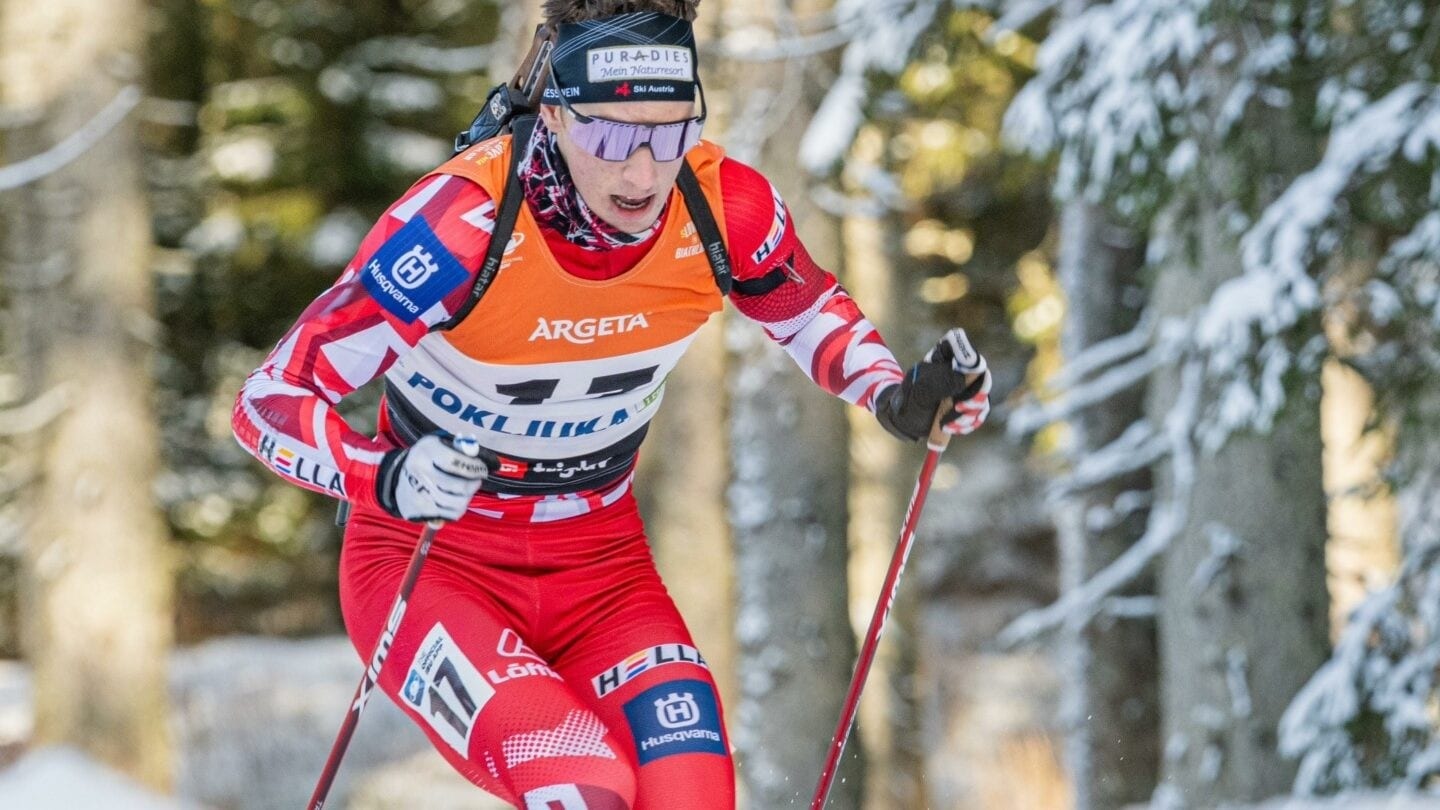
So following on from the previous article about the top 30 women under my development ranking system, it’s time to look at the junior and U23 men likewise. Interestingly, however, there are fewer U23 men competing in the top teams at the highest level at present, with Norwegian youngsters hitting against a roadblock of veteran and established talent that just isn’t underperforming enough to give them a chance, the Swedes and the Germans looking at fairly slow and gradual athlete development processes that mean their promoted talents this year are in the 24-25 age range, and many of the established young stars of the World Cup who emerged recently, such as Tommaso Giacomel or Niklas Hartweg, having aged out of the U23 ranks. The fact that men’s biathlon does not have the same kind of turnover of talent as women’s biathlon can be attributed to a couple of factors, one of which of course is that we have had a number of prominent women take time out for parenthood over the years, but the perception (not always the reality) is that more women hit the ground running at the top level while still in their junior years than men. 2023-24 would appear to be one of the seasons to reinforce that perception; the only one of the biggest teams to have an established World Cup name still eligible in the U23 ranks was the French. As a result, beyond the very top it was wide open as to who could establish themselves as the pre-eminent young prospects in men’s biathlon.
How it works
A quick recap of the scoring system, as this was explained previously:
- World Cup points are valued at 5x IBU Cup points. This includes the bonus point for positions 41-60, and makes IBU Cup podiums equivalent to finishing 25th-30th at the World Cup level.
- World Championship results are valued at 20% higher than World Cup points.
- European Championship results are valued at 20% higher than IBU Cup points.
- IBU Junior Cup points are valued at 0.2x IBU Cup points.
- Junior World Championships are valued at 0.6x IBU Cup points at the Junior level and 0.3x for the Youth level
- Other races with restricted start lists such as the Youth Olympics, EYOF or Universiade are scored at 0.1x IBU Cup points.
Once all points are tallied up, this is divided by the number of races entered (minimum 5) to arrive at a development score. The reason for the 5 race minimum is that athletes who race fewer events than this will have a greater degree of uncertainty as to whether their performance is sustainable, and also these are often national calendar athletes who enter championship races with higher points tallies and can see their results fluctuate much more heavily due to a single good or bad race. Therefore any athletes completing fewer than 5 IBU-sanctioned competitions in the season will see their total score divided by 5.
This 5-race minimum was far more significant in respect of the men, as we did see some athletes make the top 30 despite their only international racing being at the Junior World Championships – largely the product of the strength in depth of the Norwegian team and that they traditionally do not compete on the IBU Junior World Cup, preferring to develop their younger athletes within the domestic competitions.
As with the women, a quick disclaimer that while I’ve laid out the results as a top 30, it is important to note that this is less an indication of athletes’ relative talent level as much as it is an indication of athletes’ relative World Cup readiness. The higher the score, the more competitive the athlete would be expected to be at the top level. This was originally posted up on the forum, but has been revised as more of an editorial here.
#30: Matija Legović (CRO)

15/11/2005 (U19)
World Cup: 0 points from 2 races
European Championships: 0 points from 1 race
IBU Cup: 59 points from 8 races
Youth World Championships: 146 points from 3 races
Junior World Cup: 278 points from 5 races
Total points: 169.4
Development Index score: 8.92
I will say right now, I think Matija Legović is the biggest Croatian talent since Jakov Fak, and were he from a different nation he may well have a better score here; however being as the team is small in both numbers and resources, they essentially travel around as a single unit and so Matija has been competing at World Cup and European Championship races that he may not be ready to produce points-scoring level performances at. Nevertheless, a colossal PPR in excess of 50 at the Junior World Cup level – suggesting he would be averaging out at being at least in the flower ceremony every race – suggests he would be more than ready to move up to at least a permanent IBU Cup spot, and as an U19 that’s a good sign. It’s just that if he wants to deliver on his promise he may have to go the route that Jakov Fak went, and latch on to a better-funded team, as I’m not sure the Croatian team have the resources to back him all the way I’m afraid, or he may be forced to bounce around the levels depending on where the team are deploying the more established Krešimir Crnković.
#29: Arttu Heikkinen (FIN)

20/04/2004 (U20)
World Cup: 0 points from 1 race
European Championships: 5 points from 2 races
IBU Cup: 75 points from 7 races
Junior World Championships: 45 points from 3 races
Junior World Cup: 144 points from 3 races
Total points: 142.8
Development Index score: 8.93
A tough first year in Juniors for Finland’s best prospect, Heikkinen dropped back somewhat in his results at the IBU Cup level (last year he had 184 points in 8 races thanks to a super start to the season), but he made his World Cup debut and was at least pretty solid in the Junior World Championships, having a bad Mass Start but being 16th and 21st in the two individual start events. He also didn’t really spend much time at the Junior World Cup at all, only entering the Junior Euros where he won the sprint fairly convincingly; a best on the IBU Cup of 13th is promising but far from stand-out, although he has plenty of time on his side, noting that Otto Invenius only really broke out this season in his second post-junior year. The Finns seem to be pivoting toward more attention being paid to their junior and post-junior prospects in the last year or two and Heikkinen is currently, you’d say, their best placed athlete to profit from that. But he’s far from the finished article yet, and the fact he couldn’t clear all targets in any races this season points to where he will need to improve to continue to progress moving forward.
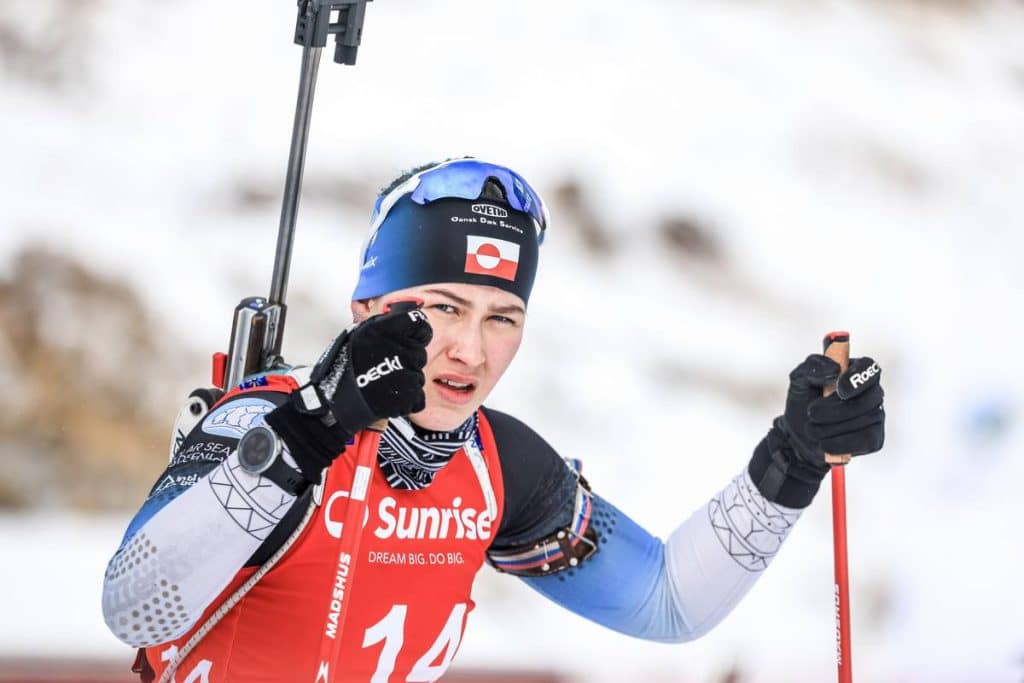
#28: Sondre Slettemark (GRL)
10/09/2004 (U20)
World Cup: 0 points from 2 races
IBU Cup: 127 points from 9 races
Junior World Championships: 29 points from 3 races
Junior World Cup: 177 points from 6 races
Total points: 184.8
Development Index score: 9.24
As a curio, with the junior races no longer available to her and with limited progress in terms of ski speed, Sondre actually outscored his big sister Ukaleq this season (she regressed from 15.29 in her U22 year to just 3.58 this season). He made a World Cup debut in Östersund but perhaps unsurprisingly as a first year junior competing for Greenland he didn’t trouble the scorers. 9 races – all in the points – in the IBU Cup is pretty solid, although apart from a single 9th place these were mostly lower placements, and a disappointing Junior World Championships limited his score. Nevertheless, he has two more years to compete at the Junior levels and he had an average of 29.5 PPR at the Junior World Cup suggesting he averages around a 12th place finish, which is certainly not bad, although I fear he will hit against the same glass ceiling his sister has when graduating juniors.
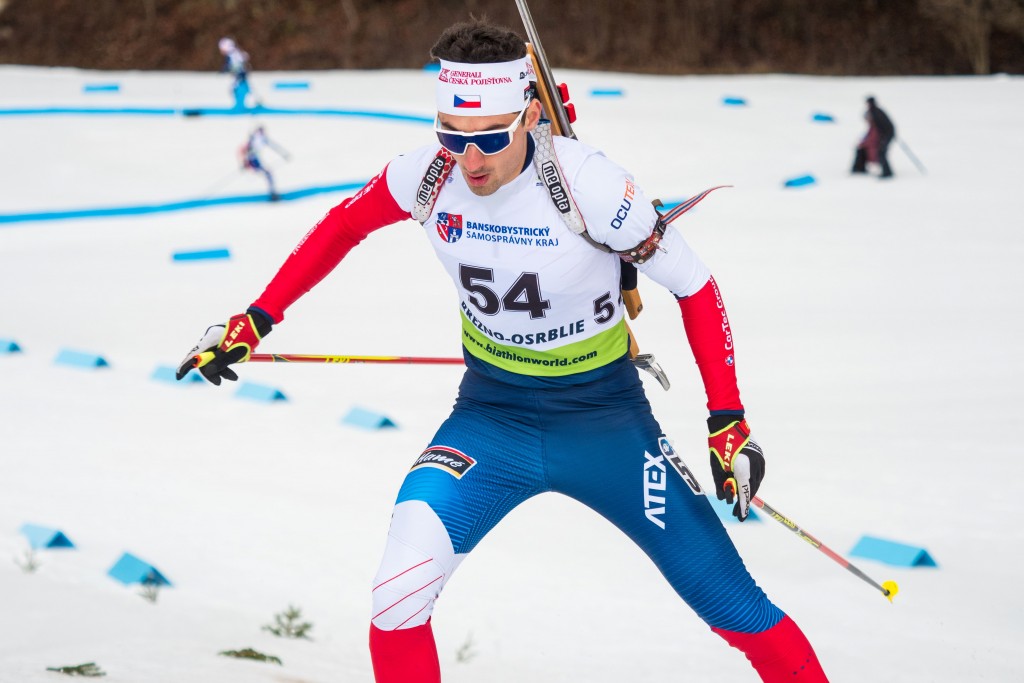
#27: Luděk Abrahám (CZE)
22/03/2002 (U22)
European Championships: 0 points in 3 races
IBU Cup: 141 points in 11 races
Junior World Championships: 66 points in 3 races
Junior World Cup: 45 points in 1 race
Total points: 196.6
Development Index score: 10.92
A fairly solid season for Abrahám in his final junior year. The Czechs are a decent midfield team, and Abrahám slots perfectly into that kind of role it would seem, performing decently but not especially spectacularly at the IBU Cup level, but reaching a flower ceremony at Idre on the one occasion in the entire season that he managed to close all of his targets in an individual race. He did manage to temper this with some washout races, and notably was well off the pace at the European Championships, but a top 10 in the Junior World Championships Sprint shows that he can be pretty solid in the higher prestige races too. He finished the season relatively strongly so confidence should be high as he moves on to his post-junior years, where I would suspect he needs a bit more seasoning on the IBU Cup before he’ll be ready for the World Cup.
#26: Fabian Kaskel (GER)
26/11/2003 (U21)
IBU Cup: 91 points in 7 races
Junior World Cup: 76 points in 3 races
Total points: 110.2
Development Index score: 11.02
Kaskel caught a few eyes in the pre-season selection races in Germany and jumping up to the IBU Cup as a second-year junior was definitely promising. However, he was found out a bit at that level, struggling to provide competitive ski speed and although he only missed the points once (a forgettable outing in a sprint in Idre), he was consistently just over 2 minutes back on 10/10 shooting in sprint races throughout December, and the strong performances of his contemporaries Linus Kesper and Leonhard Pfund on the Junior Cup, who then outperformed him at the IBU Cup level, saw him exiled to the Junior Cup for a while before he brought his season to a halt. It is still forward progress from last year, but he will need to recover that momentum and more to avoid being perceived as a Decemberist and/or becoming lost in the shuffle among his contemporaries in Germany, especially as some previously highly rated younger athletes on the team who did not race internationally this season, such as Albert Engelmann, would be expected to be gunning for the same spots.
#25: Konrad Badącz (POL)
16/01/2003 (U21)
World Championships: 11 points in 3 races
World Cup: 10 points in 11 races
Junior World Championships: 121 points in 3 races
Junior World Cup: 26 points in 1 race
Total points: 208.8
Development Index score: 11.60
It’s rather surprising, but Badącz is the only Pole to make the top 30; Jan Guńka went 3-2-8 at the Junior World Championships compared to Badącz’s 7-7-5, however both athletes spent much of the season at the World Cup given the limited resources available to the Polish team and the men’s team’s relatively quiet status for the last… well, since Tomasz Sikora retired, and Badącz’s superior World Cup performance and especially the fact that he made two top 40 results AND set his personal best of 31st at the World Championships means he makes the top 30 while Guńka does not. Both of the pair made 3 top 60s in Individuals and Pursuits out of 11 starts at the World Cup level, Badącz also managed to twice score Sprint finishes outside of the points but close enough that he was able to move forward into the points – routinely performing better H2H which augurs well for World Cup racing where this is more common. He’s also a year younger than Guńka so while Guńka had the better performances in the Championship races, he also has a tendency to be less competitive on an ongoing period so although he may have a slightly higher peak performance, Badącz is much more consistent and probably projects to be the slightly better prospect overall.
#24: Jonáš Mareček (CZE)
13/02/2001 (U23)
World Championships: 0 points in 1 race
World Cup: 30 points in 15 races
Total points: 190
Development Index score: 11.88
It’s been fairly slow progress this season for Mareček – his score last year would have been 8.93 – but in his first post-juniors year he built on his performance, increasing his World Cup workload from 10 to 15 races and scoring at a higher – although still very limited – rate, as well as receiving an increased number of relay opportunities. His World Cup individual races left him with an average finish of ~39th, hardly setting the world alight, but he’s been at least a steady hand; even if regularly finishing outside the points he is almost invariably giving himself a chance to recover a result from that, because until Oslo’s Individual he had never failed to make the top 50 on the World Cup – it’s just that he was frequently ending up between 41st and 50th in the process, with no fewer than 7 races on that page of the results sheet. His most memorable moments have largely come as part of the relays, not least at the World Championships where he was handed over to just 5 seconds off the lead, and while he lost around a minute on his leg, we should be wary of judging him too harshly on that, given he was up against Johannes Thingnes Bø.
#23: Blagoy Todev (BUL)
06/07/2001 (U23)
World Championships: 0 points in 2 races
World Cup: 21 points in 7 races
European Championships: 0 points in 2 races
IBU Cup: 25 points in 2 races
Total points: 156
Development Index score: 12.00
The best young male Bulgarian talent and a former medallist at the youth level, Todev has kind of been a victim of the small size of his team for a while, struggling to find a role at the World Cup when lower levels may have been better for his development. However, in his first post-junior year, he started slowly and improved as the year went on, scoring his first World Cup points in Oslo and then improving his PB to 32nd on the World Cup in the sprint at Soldier Hollow before backing that up by holding that rank in the following pursuit. With four World Cup top 60s and another at the World Championships he is starting to move into the realms of being somebody capable of reasonable World Cup points, especially as those points-scoring results were all with missed targets in them as well suggesting he could have gained significantly more had he shot at his best. The team have never replaced Anev following his retirement, and Iliev has been somewhat distracted this season with fatherhood, so Todev may be counted on to shoulder the load for the Bulgarian men in the near future.
#22: Anton Ivarsson (SWE)

27/01/2001 (U23)
World Cup: 0 points in 6 races
European Championships: 38 points in 3 races
IBU Cup: 142 points in 8 races
Total points: 199.6
Development Index score: 12.04
2023-24 was a challenging season for Ivarsson in his first junior year, making his debut at the World Cup level but being unable to really break through to the points; his performance relative to last year went backwards at the other levels as well (he did not race juniors in 2022-23 at all) but by so little as to say that he was fairly consistent and this was stagnation rather than regression (IBU Cup PPR went from 19.83 to 17.75) but it’s the fact that he struggled to make the top 60 let alone the points at the World Cup level that has hurt him; last year he had a score of 21.57 which was scored almost entirely at the IBU Cup level and has reduced thanks largely to those World Cup outings; however there were some positive signs late in the season, with his best results coming in the final trimester, scoring his first top 60 in Oslo and then only just missing the points in consecutive races in Canmore. Something to build on if he can hold his place in the team.
#21: Christoph Pircher (ITA)
03/07/2003 (U21)
European Championships: 7 points in 3 races
IBU Cup: 185 points in 14 races
Junior World Championships: 65 points in 3 races
Total points: 242.4
Development Index score: 12.12
Pircher is Italy’s third strongest athlete at the IBU Cup level, but Daniele Cappellari is no longer a prospect and David Zingerle is pushing 25 so approaching put-up-or-shut-up time as well; he also didn’t outperform Pircher much, with the younger (second year junior) athlete going at a PPR of 13.21 – not spectacular but at least solid – at the level. It’s his first year of racing against senior athletes too as last season he was competing solely at the Junior Cup, where he averaged almost 40 PPR so seemed to have little left to prove. While he definitely isn’t World Cup ready yet and probably should spend next season at the IBU Cup too, it is worth noting that he scored two top 10s at the IBU Cup this season – both in sprints – but his other best result of 11th, came in a Mass Start 60, as did his best showing (7th) in the Junior World Championships, which shows adaptability to H2H racing. The flip side, however, is that in three relays he did across the IBU Cup and Junior World Championships, he did penalty loops in all three (averaging two per race) and he only cleared all his targets once all season, so that’s an area of improvement to isolate for him going forward.
#20: Maxime Germain (USA)
21/08/2001 (U23)
World Championships: 0 points in 1 race
World Cup: 0 points in 7 races
European Championships: 62 points in 3 races
IBU Cup: 100 points in 4 races
Total points: 183.4
Development Index score: 12.23
Born in Juneau and raised in Chamonix before moving back to America after his interest in biathlon had already been piqued, the Alaska-native Germain already had plenty of experience at the World and IBU Cup before graduating juniors, but has yet to break through to the points at the World Cup level. In fact, he couldn’t best last year’s top result of 45th either. However, no longer able to supplement his results at the Junior level, he did score more points at the IBU Cup level, though at a similar kind of rate to that which he managed last season – in fact plugging last year’s results in, they result in a very similar score of 12.89, suggesting Germain has possibly hit a bit of a ceiling in his development unless the results of others in the team (most notably somebody higher up this countdown) can energise some investment in the US squad. American athletes tend to break through and develop later than many, though that is often due to the college system and as far as I can tell Germain doesn’t compete on the NCAA circuit (which usually targets XC rather than biathlon anyway).
#19: Fabian Müllauer (AUT)
02/02/2003 (U21)
European Championships: 0 points in 1 race
IBU Cup: 168 points in 9 races
Junior World Championships: 77 points in 3 races
Junior World Cup: 328 points in 10 races
Total points: 284.8
Development Index score: 12.38
Austria’s strongest male junior prospect, Müllauer had a pretty competitive season split between the Junior and IBU Cups this year, and given his IBU Cup PPR is 18.67 this suggests that like Andexer he is a bit held back by the amount of racing the Austrian team had him do at the Junior Cup where fewer points are available on my scoring system. However, there is one thing which is very clear when discussing Müllauer as an athlete, and that’s that he needs to work on his shooting. When he gets the shooting mostly right, he is highly promising – his best of 6th on the IBU Cup came in a sprint with 9/10 and he also made 5th at the Junior World Championships in the same discipline in similar fashion. He clearly has a high ceiling but he’s a boom-or-bust athlete as a result. At the Junior Cup level, his speed is enough that he can get away with his profligacy with the rifle (he had sprint podiums at Ridnaun and Jakuszyce with 6/10 and 7/10 respectively) but a 67.2% shooting record in individual races season-long is always going to hold him back unless he can up that hit rate significantly. He still has high potential, but he projects to be a Julian Eberhard type as his ceiling unless he can improve his performance in the range.
#18: Antonin Guy (FRA)

16/02/2006 (U18)
Junior World Championships: 147 points in 3 races
Youth Olympic Games: 180 points in 2 races
Total points: 62.1
Development Index score: 12.42
The youngest of all the athletes to make the top 30 of either gender, Guy is the only 2006 athlete to get a high enough score to feature – not bad when you consider 2 of the 5 eligible races he entered were the Youth Olympic Games where the maximum score would only net you a score of 9. But the crucial thing is that he did get that score of 9, winning both races in Gangwon and then also winning the Youth Individual at the Junior Worlds for good measure. While he couldn’t keep it up and only managed 14th and 6th in the other two races, showing that winning mentality is always helpful and interestingly 2/3 of those wins were in Individuals, with 17/20 and 19/20 respectively. I’m cautious about getting overexcited about a youth athlete who wins a lot largely in shooting-biased events, after people like Aristide Bègue stalled out and especially as the ski distances are reduced but the penalties remain the same at the youth level, but simultaneously he also showed very good capability in relays and the Mass Start 60 so he does have all the tools if he can harness them going forward.
#17: Tobias Alm (NOR)

07/09/2002 (U22)
Junior World Championships: 113 points in 3 races
Total points: 67.8
Development Index score: 13.56
Tobias Alm is probably the biggest question mark on the entire list for me. He’s in his final junior year, and he has no FIS profile so sticks exclusively to biathlon, but the 2024 Junior World Championships in Otepää are his first results to appear in the IBU’s database and he hasn’t stood out to me especially in Norgescup results either for me to have picked up on his name and paid attention the way people like Gerhardsen did when I saw their names in the Junior World Championships selection. However, that’s seemingly more a reflection of the insane strength in depth of the Norwegian team (after all, the Norgescup is also full of athletes between 23 and 27 who could compete internationally for many a nation) than an indictment of Alm’s talent level because he was able to finish top 15 in both the Individual and Sprint before securing a Norwegian 1-2-3 with bronze in the MS60. Being outshone by younger and more established fellow juniors means that he might be a bit roadblocked until some older athletes retire, but that’s unfortunately the price you pay for the level of competition on the Norwegian calendar. It produces elite talents – but it also means not everybody that has the talent to make it can.
#16: Renars Birkentals (LAT)

23/05/2001 (U23)
World Championships: 0 points in 2 races
World Cup: 33 points in 12 races
European Championships: 36 points in 3 races
Total points: 234.2
Development Index score: 13.78
Birkentals has impressed me this season; last year he was largely out of his depth in the senior fields but scoring decently on the Junior Cup, but with this being his first post-junior year he was forced to make the step up to the senior levels and sink or swim. Östersund was very uncompetitive but from Hochfilzen through to Antholz he was consistently in or around the fringes of the points at the World Cup level, with a best of 27th at the Oberhof sprint. However, he couldn’t maintain this kind of performance level forever and his form dropped away in the final trimester, falling down to the ranks of the 80s and 90s in the North American rounds at the end of the season. As a result his overall World Cup PPR is only 2.75, but nevertheless this season at least suggests even if you have to accept a few washout races, he is going to get you into the top 40 with some regularity. The Latvians have been a one-man team around Andrejs Rastorgujevs for as long as I can care to remember, but Birkentals looks to be the closest they’ve been to having any kind of succession plan in a long time.
#15: Linus Kesper (GER)

06/03/2003 (U21)
European Championships: 30 points in 2 races
IBU Cup: 38 points in 3 races
Junior World Championships: 105 points in 3 races
Junior World Cup: 158 points in 4 races
Total points: 172.6
Development Index score: 14.38
While 2003 is perhaps perceived as a weaker prospect year on the women’s side, it’s probably the strongest year in a while for the German men, and Linus Kesper is one of the main prospects in that pipeline. While contemporary Fabian Kaskel got the season started better, Kesper started out on the Junior Cup where he podiumed on debut and earned his way into the European Championships (which was something of a surprising selection, but he repaid the selectors’ faith with a top 20 on debut there too) and an IBU Cup place, and then scored a 6th and a bronze medal at the Junior World Championships, although he had a bad MS60 that affects his rating here. It was a close and interesting battle between him and Leonhard Pfund for the top German junior actually, with Kesper performing better at the European Championships but Pfund better at the Junior Worlds. I look forward to their rivalry driving some German development in the years to come.
#14: Kasper Ågheim Kalkenberg (NOR)
27/05/2005 (U19)
Youth World Championships: 255 points in 3 races
Total points: 76.5
Development Index score: 15.30
The almost undisputable top talent among the men’s youth field, Kalkenberg is another part of that tradition of biathlon families in Norway, as – as you can probably guess – he’s Emilie’s brother. Unfortunately given the Norwegian propensity not to fulfil their allocations at the IBU Junior Cup, we seldom get to see him racing internationally, but when he does he tends to knock it out of the park; he was already a winner of the Youth World Championships sprint in 2022-23, but this year he decided to step up his performance, finishing 2nd in the Individual and then winning both the sprint and MS60, with Matija Legović the only athlete who could even come close to matching his time on the skis. He only lost out by 9 seconds in the Individual despite an extra miss and the shorter ski laps as well. His score is restricted somewhat because he entered fewer than 5 IBU-sanctioned races and we haven’t seen him compete against U22s let alone seniors, but he is clearly capable of far more than he’s able to show against U19s only.
#13: Leonhard Pfund (GER)
17/05/2003 (U21)
European Championships: 13 points in 2 races
IBU Cup: 101 points in 5 races
Junior World Championships: 122 points in 3 races
Junior World Cup: 176 points in 4 races
Total points: 229
Development Index score: 16.36
As mentioned when I covered Linus Kesper at #15, the two German 2003 prospects largely followed the same calendar and were closely matched throughout. However, Pfund earned his promotion to the IBU Cup sooner after winning on the Junior Cup in Ridnaun, and had a better IBU Cup best, with a pair of 12th places at Martell and – again – Ridnaun. The main crux of Pfund’s season, however, was the Junior World Championships, where much like Kesper he had one bad race (in his case the sprint) and two good ones, with 10th in the MS60 and, more importantly, the gold medal in the Individual after hitting 19/20 and outskiing Lejeune. He has another year of junior eligibility but I suspect he will be up on the IBU Cup full-time next season with Doll retiring and Riethmüller likely earning semi-permanent promotion, and will look to improve on his PPR of 20.2 at that level.
#12: Théo Guiraud Poillot (FRA)
01/01/2002 (U22)
European Championships: 72 points in 3 races
IBU Cup: 222 points in 14 races
Junior World Championships: 58 points in 3 races
Total points: 355.2
Development Index score: 17.76
Guiraud Poillot is one of a few French juniors who are trying to break through the IBU Cup ceiling as they graduate juniors, and also an illustration of one of the foibles of the system – he has a higher score than Ivarsson by far despite a lower IBU Cup PPR (15.86 as against 17.75) and no World Cup results; however, TGP proved far stronger in the European Championships, whereas Ivarsson’s development hopes will be stalled somewhat by the difficulty adapting to the World Cup. The problem for Guiraud Poillot, like a couple of his French contemporaries, is that his ski speed is probably going to need work for him to be able to succeed at the World Cup level, although this does appear less of an issue than for Lejeune, Jefferies or Garnier in the same age group. He wasn’t far off Rastorgujevs at the European Championships, but that was his peak vs. Rastorgujevs’ racing for form, but it gives an illustration of where he might be if he can progress into his first post-junior year next season.
#11: Damien Levet (FRA)

29/06/2001 (U23)
European Championships: 0 points in 3 races
IBU Cup: 426 points in 20 races
Total points: 441
Development Index: 19.17
Levet has been the model of consistency in his first post-junior year, spending the whole season at the IBU Cup and neither really looking like getting promoted, nor ever looking like he was struggling or out of his depth. His only results out of the points were at the European Championships, however, which is a concern as it showed him to not be able to compete when the stronger field arrived at the level. He only had two visits to the flower ceremony all season – a sprint/pursuit double back in Idre – and these were his only top 10s as well. As a result he has the problem of being consistent at this level but, despite his stronger overall performance, he is likely to be behind Guiraud Poillot in the promotion queue due to being perceived as having a lower performance ceiling. The dominance of the Norwegians at this level does skew expectations a little, but he probably needs to get that PPR of just over 20 up to at least 30 and probably closer to 40 before the team is likely to try him at the World Cup.
#10: Vitalii Mandzyn (UKR)
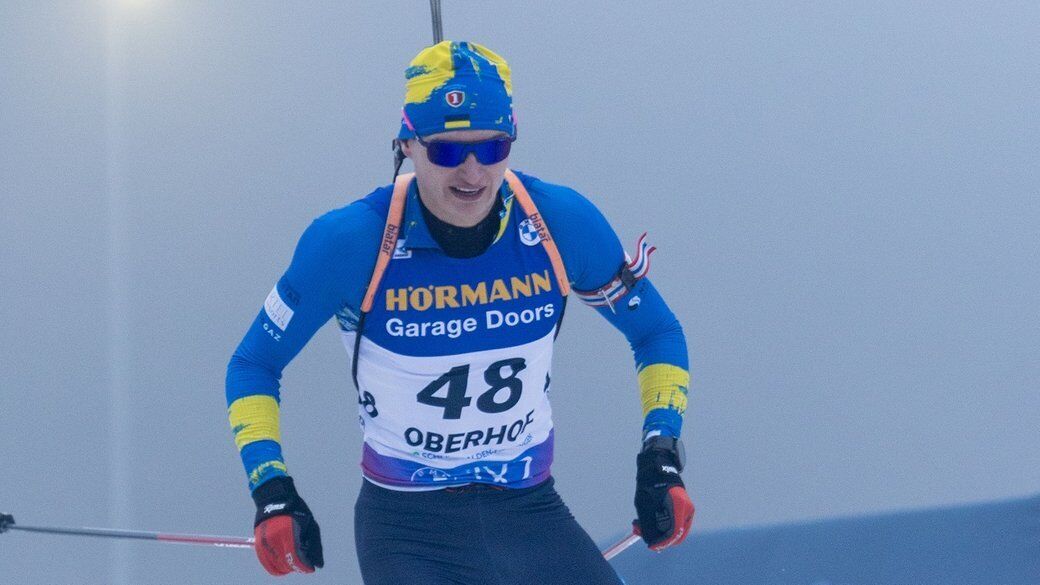
05/04/2003 (U21)
World Cup: 12 points in 6 races
European Championships: 54 points in 2 races
IBU Cup: 167 points in 7 races
Junior World Championships: 103 points in 3 races
Junior World Cup: 153 points in 3 races
Total points: 406.2
Development Index score: 19.34
Arguably Ukraine’s top prospect of either gender, Vitalii Mandzyn has been seen as the coming man for the last couple of highly disrupted years for the country. He made his World Cup debut in 2022-23 but was somewhat out of his depth at that point, but in this, his second junior year, he was much more at home at the level, although the team did move him between levels fairly frequently. He spent December at the IBU Cup where he was consistently in the top 15 before returning to the World Cup at Oberhof. Traditionally something of a baptism of fire, he actually adapted well to Oberhof, scoring all of his points there with a PB of 31st in the sprint. This is probably due to his ski speed needing work as in the more forgiving range of Ruhpolding where more athletes were shooting well he was outside the points, but he did still qualify for the pursuit. He then did a tour of championships, doing the Europeans, the Junior Europeans, and the Junior Worlds in quick succession, getting a silver from the middle one in the MS60 and a silver in the latter in the relay where he anchored the team home, passing the fancied French team for the medal after Jacques Jefferies’ late penalty, as well as securing two fourth places, in the MS60 at the Junior Euros and the Individual at the Junior Worlds. He’s not the finished article yet, but he’ll be among the favourites should the Ukrainians deploy him at the Junior Worlds next season again, and his progress at the World Cup level suggests he’s heading in the right direction.
#9: Valentin Lejeune (FRA)
29/12/2002 (U22)
World Cup: 0 points in 1 race
European Championships: 49 points in 3 races
IBU Cup: 256 points in 13 races
Junior World Championships: 118 points in 3 races
Total points: 396.6
Development Index score: 19.83
The top-scoring French prospect in the junior ranks is Lejeune, who in his final Junior year spent most of the season at the IBU Cup, though he did earn himself a World Cup debut in Antholz. He actually has a slightly worse IBU Cup PPR than Levet (19.69 against 21.30) but this was countered by a far superior set of European Championship performances, thanks to top 20s in the sprint and pursuit. However, it is worth noting that he only made a single trip to the flower ceremony at the IBU Cup, so he is possibly a bit fortunate to have earned that single run-out in the World Cup, largely precipitated by others taking time out preparing for Nové Město. He did, however, score a silver medal in the Individual and a 6th place in the Sprint at the Junior World Championships, though given both of these were on perfect shooting, he may need to work on his ski speed to be able to make the next step up, and how well he can do this will ascertain whether he projects to be more like Aristide Bègue or Antonin Guigonnat going forward as those are the two comparables I see for him.
#8: Elia Zeni (ITA)
05/06/2001 (U23)
World Championships: 0 points in 1 race
World Cup: 64 points in 17 races
Total points: 370
Development Index score: 20.56
Zeni to some extent had a similar season to Jonáš Mareček, spending the whole season at the World Cup with several races in the 35th-50th kind of range – likewise 7 results in the 40s. However, his PPR is nearly double (approaching 4), and three results in the top 30 push his score up, one in Ruhpolding and then two as part of an excellent finish to the season, in Soldier Hollow and Canmore. He had almost as many results in the points as outside and a good jump up from last year’s results which were largely at the Junior Cup and IBU Cup and would have been good for a score of 11.26. For the moment he’s very much the makeweight in the team, with the Italian team’s youth movement largely led by Giacomel and Bionaz who are a year older and have aged out of the U23 ranks as a result, and his role is largely to not mess up in the relay and hold the team at a decent level; usually on leadoff duty, which he’s largely done pretty well at. He may never be anything more than a role player at the World Cup level but you could do far worse than him in that role for sure.
#7: Sivert Gerhardsen (NOR)

21/07/2004 (U20)
Junior World Championships: 172 points in 3 races
Total points: 103.2
Development Index score: 20.64
The last of our hard-to-categorise junior-age Norwegians who rock up for the championships only, Gerhardsen gets the highest scores thanks to 3 top 10s including a win in the MS60 at the Junior level. Not bad considering he’s a year one junior. The only other IBU-sanctioned racing he’s done has been at last year’s Junior Worlds where he got a complete set of medals in the Youth categories, again with the gold medal being in the pursuit, the only H2H race on the program there, which tells you that, like the senior team whose podium lockouts tend to be confined to pursuits and mass starts, he seems to be more adept at head to head racing than many of his contemporaries. Shooting 20/20 in such circumstances as a teenager is a promising sign indeed, but unfortunately we don’t have too much else to go on outside of the domestic competitions. He would have scored 13.5 from his Junior World Championships performances from last year, with the same restriction on number of races as this year, so there is progress moving from youths to juniors which is encouraging – except for those hoping for an end to the Norwegian domination who eye this terrifyingly strong production line with concern.
#6: Lovro Planko (SLO)
28/05/2001 (U23)
World Championships: 19 points in 3 races
World Cup: 108 points in 15 races
Total points: 689
Development Index score: 38.28
While a lot of attention has been paid to the Slovene young women coming through (Repinc in particular), on the men’s side Lovro Planko has made some significant progress as the team looks to an impending era with neither Fak nor Bauer, who carried their team for most of the last 15 years. Alex Cisar (who has now aged out of this anyway) barely raced this year so the mantle fell to Planko to give hope for the future and I’d say he achieved that; he had a solid 2022-23 split across multiple races and settled in to a World Cup berth this season; last year his World Cup PPR was 1.42, this year he improved that to 7.2 while matching his World Championships performances. He’s become a regular in the minor points – showing the level above the likes of Zeni and Mareček with no fewer than 10 results between 30th and 40th place, but it’s that clean-shooting 9th place in Lenzerheide that most stands out, showing that he does have the potential to step forward and score some much bigger points. He had a dreadful January before recovering somewhat at Nové Město and the final trimester – but then Cisar had a good 2022-23 and was nowhere this season so Planko will be wary of following in those footsteps.
#5: Martin Uldal (NOR)
23/05/2001 (U23)
European Championships: 128 points in 3 races
IBU Cup: 852 points in 18 races
Total points: 1019.6
Development Index score: 48.55
Here we have the first of Norway’s IBU Cup wrecking crew; the men’s IBU Cup has been even more of a Norway-fest than the World Cup, thanks to their insane overspill of talent. Surely if they were from pretty much any country, any one of Johan-Olav Botn, Mats Øverby, Martin Uldal, Martin Nevland and Isak Frey would be on the World Cup, but instead they’re forced to ply their trade at the second tier, which has resulted in highly one-sided races especially once the likes of Philipp Horn and Danilo Riethmüller earned promotions – no fewer than TWELVE races between the IBU Cup and the European Championships have seen a Norwegian podium lockout, with 2 of those being a 1-2-3-4, three being a 1-2-3-4-5, and one even being a 1-2-3-4-5-6. Uldal has been one of the quieter members of the wrecking crew, with “just” two wins and seven podiums, but he has still got a stunning 47.33 PPR at the IBU Cup level meaning he averages a top 5. Some uneven shooting and an awful week at altitude in Martell bring his average down a little, and that he finished 4th on the IBU Cup as a result means he’s probably going to be stuck at this level for another year now simply because others will be ahead in line for promotion – and there’s already not enough room at the top with both Sørum and Botn in addition to the 6 regular World Cup starters. He has, however, probably reached the ceiling of what he can at the IBU Cup, as last year would have earned a score of 51.11 so he’s essentially being forced to stagnate by the lack of opportunity to move up.
#4: Martin Nevland (NOR)
16/06/2001 (U23)
European Championships: 121 points in 3 races
IBU Cup: 916 points in 19 races
Total points: 1075.2
Development Index score: 48.87
Nevland is much like Uldal, but slightly stronger, with a PPR of 48.21 to Uldal’s 47.33 and finishing 3rd in the IBU Cup overall so he is likely to be – just – ahead in the scramble for places. He also, unlike Uldal, has the benefit of upward momentum, having had a PPR of 36.57 last season so improving his scores year on year. He also seems to have slightly more faith from the team brass in respect of team races, although he only entered two SMRs this season and no Mixed Relays; that’s still more than Uldal’s none, however. He did, on the other hand, only score the one victory – an MS60 on home snow in Sjusjøen back in December – along with six podiums, and was often the one sat in the flowers when the team did one of those 1-2-3-4/-5/-6 results. On the flip side of things, Nevland’s floor is extremely high; apart from an anomalous 50th place in the Short Individual at Obertilliach (and given he DNSed the ensuing sprint, this suggests he may have been ill or crashed), he was never, not once, outside the top 15 all season – and only twice outside the top 10. That’s right, from 22 races this season across the IBU Cup and European Championships, Martin Nevland was in the top 10 on 18 occasions. So while he may not be the guy that is going to swashbuckle to victory left right and centre, he would at least likely make the kind of Franziska Hildebrand, Andrea Henkel, Evgeny Ustyugov type – just somebody who is metronomically scoring points and taking results pressure off of his teammates. Not that there’s really much results pressure for the Norwegian men in any respect other than knowing there’s always somebody highly capable ready to take your place, of course.
#3: Isak Frey (NOR)
28/08/2003 (U21)
European Championships: 195 points in 3 races
IBU Cup: 727 points in 13 races
Junior World Championships: 215 points in 3 races
Total points: 1101
Development Index score: 57.95
The top Norwegian prospect, and when you consider all of the ground that covers, it tells you how good this guy is. He’s vaulted over not only all the 2002 athletes and his contemporaries, but many of the 2001 guys too – ahead of Trym Gerhardsen, Einar Hedegart, Johannes Willassen, both Alm brothers, and many of the veterans who are far from old – Vetle Rype Paulsen, Jørgen Sæter, Simon Kirkeeide… in all honesty I think he belongs above Nevland, Øverby and Uldal, but his youth meaning he can be deployed elsewhere than just the World and IBU Cup means he may be forced to wait in line. He was only 5th overall in the IBU Cup, but crucially this was from 13 races to Nevland’s 19 and Uldal’s 18, for a superior PPR of 55.92, plus when the results had something on the line he also raised his game, with 5-3-1 his results at the European Championships, and delivering when expected to at the Junior World Championships, going 4-1-2 there as well. He had two wins at the IBU Cup, one at the European Championships as mentioned, five podiums and five flower ceremonies – yes, 13 out of 16 races he was in the flowers. His worst result of the entire year was 8th. He’s two years younger than Uldal and Nevland, three younger than Øverby and four younger than Botn, and is already competing at a comparable level, being able to ski among the very best on the IBU Cup and when he hits targets he’s going to at least podium. He ought to be on the World Cup before long – the only problem is, as I’ve said with many athletes on this countdown already… he’s Norwegian, so he needs somebody to perform badly enough to allow the door to open, and he’s got to wait his place in the queue and hope that the team look at things like PPR and upward momentum, not just hard points totals at the IBU Cup. And nobody seems to be performing badly enough to even make that a question anyway.
#2: Campbell Wright (USA)

25/05/2002 (U22)
World Championships: 103 points in 4 races
World Cup: 216 points in 13 races
Total points: 1728
Development Index score: 101.65
Campbell Wright was already a highly vaunted prospect while he was competing for New Zealand, but he has kicked on a level since being fully integrated into the US team and being able to benefit from full support rather than just collaboration with the team. The tendency to replenish their ranks through the NCAA skiing competitions means the Americans tend to see their athletes break through at older ages, with the likes of Dunklee, Irwin and Egan already being in their 30s when they started to hit the front sheet of the results page, and it’s a strange situation where their best younger athletes are Germain – born in the US but raised in France – and Wright who was born and raised in New Zealand. However, Wright is also a can’t miss kind of talent and getting him to represent them early on is a coup. His score for last season was 29.62 but this season he exploded to scoring regular top 20s especially in the latter season. His overall World Cup standing doesn’t really show it because he missed much of December sick, but his PPR jumped up from 5 in 2022-23 to 16.62 this season, suggesting an average finish of ~24th on the World Cup; last year while racing for New Zealand the Junior World Championships were a target but now with the US team he focused on the outright World Championships because, despite being still eligible for the YJWCH, he’s clearly their best talent, and he repaid them with four top 20s there, and then a super final trimester where he twice set PBs, with his first top 10 in Oslo, and then his first flower ceremony on “home” snow in Soldier Hollow. His aim for next year is surely to hit the podium.
#1: Éric Perrot (FRA)

29/06/2001 (U23)
World Championships: 143 point in 4 races
World Cup: 622 points in 21 races
Total points: 4028
Development Index score: 161.12
All too obviously the best U23 in the world right now, Eric Perrot has essentially graduated beyond being a development athlete, and his score only continued to grow exponentially further above anybody else with a super final trimester capped by that maiden World Cup win in Soldier Hollow and a further podium in Canmore. 12 of his 25 top level races this season resulted in top 10 finishes, three of which were at the World Championships, and he only missed the points once, that being a 45th-placed finish in the Oberhof sprint where he missed four targets. He ended up finishing 11th on the overall World Cup and essentially managed the same kind of performance emerging out of his first post-junior year this season as was managed in 2022-23 by Niklas Hartweg (whose season would have netted a score of 162.73). It was fairly predictable in fairness – even as a final year junior Perrot’s 2022-23 season scored 69.42 which was the third best behind two athletes who are now too old for U23 (Hartweg and Giacomel) and he improved his World Cup PPR from 15.75 to 29.62 which suggests an average finish of ~12th. There’s not much left for Perrot to do than keep doing what he’s doing, he’s the clear best in his age group and any even incremental improvements should see him become a regular in the flower ceremonies and podiums.
Takeaways
As much as the women’s countdown was dominated by the Germans and the French, there’s one inescapable conclusion from the top 30 prospects on the men’s side of the sport: anybody hoping for a swift end to the current era of absolute Norwegian domination is likely to be sorely disappointed. They only have 6 athletes in the countdown, but they’re all in the top 20 and three of them are in the top 5. And that’s with three of them – Alm, Kalkenberg and Gerhardsen – having their points affected by the lack of international racing as well.
The other thing that is clear to note is the difference between the way the points are distributed for the men and the women; the score required for Voldiya Galmace Paulin to achieve 30th place on the womens’ countdown would place her 18th on the mens’ list, while the score achieved by Legović for 30th rank here would have placed him just 42nd on the womens’. There is a clear three-step scoring system among the men whereas the women’s scores gradually step up throughout the countdown; there are the established World Cup names at the top (Perrot and Wright), then a clear jump down to the IBU Cup-dominating Norwegians with Planko also joining that group, then a clear step back to everybody else. The extent of the Norwegian domination of the IBU Cup is likely the largest reason for those divides; that scoring range from 20-35 among the women was filled with athletes who were competitive on the IBU Cup and scored some podiums or wins here and there – people like Randby, Bondoux, Schumann and Andexer – whereas on the mens’ IBU Cup, the podiums and even flower ceremonies were frequently locked out by the Norwegians, meaning the equivalent level athletes – the likes of Lejeune, Levet and Guiraud Poillot – were settling for scraps in the lower top 10 and top 20.
Another point of interest is the difference between the German men and women. Not one German man makes the top 10 here, and only three make the top 30 at all – all from the 2003 generation. Benjamin Menz’s score from 2022-23 would have had him at the bottom end of the top 10, but he regressed badly this season, while other hotly-tipped prospects like Albert Engelmann didn’t compete internationally. The Swedes also have some cause for concern about the pipeline – more so than among the women, in fact – as their only entrant in the top 30 is fairly far down and ageing out as well. Oscar Andersson scored 18 PPR in the junior ranks and Martin Höiby 23 PPR in the youth ranks at Otepää so not all is lost, but as with the women, the decision to follow the Norwegians’ lead and compete at home only outside of the championships at the junior level may have backfired.
Some of the bigger youth-age prospects just missed out on the top 30 – Jakub Kulbin of Estonia for example, while in the U20 ranks Jakub Borgula of Slovakia also was just outside; Kulbin would have slotted in at #28 had he not made his World Cup debut this season, but that this looks to be a year or two too soon for him did provide a bit of perspective.