real biathlon
    • Athletes
    • Teams
    • Races
    • Seasons
    • Scores
    • Records
    • Blog(current)
    • More
      Patreon Content Course Profiles Explanations Shortcuts
      Error Report
      Privacy Policy About
    •     
  • Forum
  • Patreon
  • Twitter
  • YouTube
    Instagram
    Facebook

Recent Articles

  • Most improved athletes this winter
  • New biathlon point system
  • Historic biathlon results create expectations. But what about points?
  • What do you expect? Practical applications of the W.E.I.S.E.
  • Introducing W. E. I. S. E: the Win Expectancy Index based on Statistical Exploration, version 1

Categories

  • Biathlon Media
  • Biathlon News
  • Long-term trends
  • Statistical analysis
  • Website updates

Archives

  • 2022
    • December
    • June
    • May
    • March
    • February
    • January
  • 2021
    • December
    • November
    • September
    • July
    • June
    • May
    • April
    • March
    • February
    • January
  • 2020
    • December
    • November
    • August
    • June
    • March
  • 2015
    • December
  • 2013
    • August
    • July
  • 2012
    • July

Search Articles

Recent Tweets

Tweets by realbiathlon

Month: January 2022

Best performers in January

Posted on 2022-01-23 | by real biathlon | Leave a Comment on Best performers in January

Who is in top shape going into the Winter Olympics which start in less than two weeks? A lot of favorites skipped some races recently, still the January results probably give a better indication of current form than the races in December.


Note: The scores are standard scores (or z-scores), indicating how many standard deviations (SD) an athlete is back from the World Cup mean (negative values indicate performances better than the mean). The Total Performance Score is calculated by approximating the importance of skiing, hit rate and shooting pace using the method of least squares (for more details, see here and here), and then weighting each z-score value accordingly.


Men

2021–22 z-Scores in January | Non-Team events

NoFamily NameGiven NameNationRacesRank
(avg)
Points
(avg)
Ski Speed
Score
Hit Rate
Score
Range Time
Score
Total
Performance
Score
NoFamily NameGiven NameNationRacesRank
(avg)
Points
(avg)
Ski Speed
Score
Hit Rate
Score
Range Time
Score
Total
Performance
Score
1LoginovAlexandrRUS
59.439.8-1.43-1.00-0.72-1.22
2LaegreidSturla HolmNOR
43.844.8-1.51-0.80-0.40-1.17
3BoeJohannes ThingnesNOR
413.832.5-1.83-0.07-0.58-1.17
4BoeTarjeiNOR
46.341.5-1.78-0.36-0.01-1.16
5Fillon MailletQuentinFRA
66.744.5-1.44-0.67-0.93-1.16
6DollBenediktGER
613.233.7-1.40-0.77-0.79-1.14
7SamuelssonSebastianSWE
410.335.0-1.27-1.04-0.48-1.11
8LesserErikGER
48.834.0-1.04-1.04-1.09-1.04
9TsvetkovMaksimRUS
423.516.2-1.10-1.040.10-0.94
10SerokhvostovDaniilRUS
414.821.2-1.13-0.70-0.32-0.91
11DesthieuxSimonFRA
616.726.8-1.02-0.87-0.43-0.90
12ClaudeFabienFRA
617.324.2-1.14-0.36-1.00-0.90
13JacquelinEmilienFRA
520.426.0-0.91-0.62-1.31-0.87
14KhaliliSaid KarimullaRUS
526.617.2-0.96-1.00-0.14-0.87
15BabikovAntonRUS
519.632.0-0.77-1.12-0.59-0.85
16HoferLukasITA
421.020.5-1.07-0.36-0.52-0.80
17BakkenSivert GuttormNOR
421.021.0-1.15-0.07-0.74-0.79
18SeppalaTeroFIN
619.023.2-0.91-0.67-0.45-0.78
19EderSimonAUT
521.618.5-0.44-1.12-1.47-0.76
20NawrathPhilippGER
433.010.5-1.28-0.020.07-0.75
21LeitnerFelixAUT
429.813.5-0.92-0.51-0.47-0.74
22SmolskiAntonBLR
620.324.8-1.04-0.360.08-0.71
23ReesRomanGER
515.027.4-0.71-0.74-0.58-0.70
24PonsiluomaMartinSWE
431.014.0-1.110.32-0.81-0.66
25ChristiansenVetle SjaastadNOR
419.321.8-0.94-0.07-0.31-0.61
26ClaudeFlorentBEL
622.219.5-0.52-1.070.31-0.58
27KrcmarMichalCZE
628.513.8-0.55-0.77-0.11-0.56
28HiidensaloOlliFIN
530.211.3-0.52-0.74-0.24-0.55
29BormoliniThomasITA
622.217.7-0.64-0.46-0.23-0.54
30GuigonnatAntoninFRA
541.012.0-0.73-0.11-0.63-0.54
31StroliaVytautasLTU
521.220.8-0.52-0.49-0.34-0.49
32VaclavikAdamCZE
539.25.8-0.850.15-0.16-0.48
33PidruchnyiDmytroUKR
432.310.0-0.770.49-1.15-0.45
34BurkhalterJoschaSUI
427.313.80.02-0.87-1.75-0.45
35IlievVladimirBUL
541.87.4-0.800.020.14-0.45
36PovarnitsynAlexanderRUS
537.03.2-0.34-0.53-0.78-0.45
37GiacomelTommasoITA
443.84.5-0.910.66-0.70-0.43
38WindischDominikITA
537.411.0-0.840.53-0.57-0.41
39TsymbalBogdanUKR
533.412.8-0.26-0.74-0.33-0.41
40FakJakovSLO
537.811.8-0.11-0.87-0.63-0.39

Women

2021–22 z-Scores in January | Non-Team events

NoFamily NameGiven NameNationRacesRank
(avg)
Points
(avg)
Ski Speed
Score
Hit Rate
Score
Range Time
Score
Total
Performance
Score
NoFamily NameGiven NameNationRacesRank
(avg)
Points
(avg)
Ski Speed
Score
Hit Rate
Score
Range Time
Score
Total
Performance
Score
1RoeiselandMarte OlsbuNOR
41.358.5-1.36-1.35-1.94-1.43
2OebergHannaSWE
46.341.0-1.45-0.73-1.99-1.31
3SimonJuliaFRA
68.239.0-1.30-0.61-2.10-1.20
4OebergElviraSWE
46.344.0-1.52-0.73-0.71-1.19
5AlimbekavaDzinaraBLR
64.343.7-1.37-0.79-1.26-1.19
6WiererDorotheaITA
66.840.2-1.14-0.51-2.29-1.10
7BrorssonMonaSWE
511.032.0-1.39-0.54-0.55-1.04
8Braisaz-BouchetJustineFRA
614.031.7-1.760.14-0.30-1.03
9Chevalier-BouchetAnaisFRA
58.835.6-0.94-0.89-1.50-0.99
10DavidovaMarketaCZE
613.528.2-1.23-0.51-0.24-0.90
11SolaHannaBLR
523.016.7-1.420.51-1.65-0.89
12TandrevoldIngrid LandmarkNOR
48.533.8-1.26-0.22-0.11-0.82
13ReztsovaKristinaRUS
516.226.4-1.370.39-0.98-0.81
14HauserLisa TheresaAUT
613.027.7-0.83-0.33-1.71-0.79
15PerssonLinnSWE
426.318.8-1.11-0.11-0.70-0.77
16NigmatullinaUlianaRUS
534.816.2-0.76-0.77-0.46-0.72
17Hojnisz-StaregaMonikaPOL
428.014.5-0.73-0.73-0.65-0.72
18ChevalierChloeFRA
618.522.5-0.95-0.42-0.11-0.69
19VoigtVanessaGER
517.623.8-0.56-1.240.07-0.68
20BescondAnaisFRA
623.524.8-1.02-0.05-0.51-0.67
21HildebrandFranziskaGER
622.819.0-0.91-0.33-0.28-0.66
22StremousAlinaMDA
622.718.3-0.93-0.791.35-0.61
23VasnetcovaValeriiaRUS
626.718.0-0.840.04-1.08-0.61
24HinzVanessaGER
435.510.3-0.82-0.11-0.42-0.56
25EderMariFIN
522.415.5-1.240.390.46-0.56
26KazakevichIrinaRUS
630.814.2-0.94-0.140.29-0.56
27MinkkinenSuviFIN
438.88.8-0.24-0.89-1.35-0.56
28HaeckiLenaSUI
431.010.3-0.43-0.22-1.94-0.55
29TodorovaMilenaBUL
536.45.6-0.840.04-0.30-0.52
30ErdalKarolineNOR
436.014.3-0.52-0.42-0.54-0.49
31BendikaBaibaLAT
436.55.4-0.950.35-0.16-0.48
32SanfilippoFedericaITA
444.55.0-0.930.040.64-0.46
33HerrmannDeniseGER
428.59.6-1.140.660.16-0.46
34JislovaJessicaCZE
622.318.7-0.25-1.070.00-0.46
35ZukKamilaPOL
431.810.3-0.950.51-0.36-0.45
36TomingasTuuliEST
533.08.6-0.64-0.300.19-0.44
37LienIdaNOR
433.510.8-1.070.580.19-0.44
38FialkovaIvonaSVK
542.82.0-0.790.39-0.72-0.44
39LeshchankaIrynaBLR
441.59.6-0.880.35-0.12-0.43
40LieLotteBEL
636.57.8-0.09-0.89-0.60-0.39
Posted in Statistical analysis | Tagged 2021–22 season, Data, overall performance

Has the field gotten narrower?

Posted on 2022-01-21 | by biathlonanalytics | Leave a Comment on Has the field gotten narrower?

Introduction

After listening to an episode of Doppelzimmer, a german podcast in which Erik Lesser and Arnd Peiffer talk about biathlon, I got curious. Curious about analyzing if the field has gotten narrower between biathlon nations in the last two decades. Erik and Arnd were talking about this and saying that people always mention the field is getting narrower, but that it would be interesting to do some analysis about it to see if this is actually true. This is my analysis on that topic.

Data

For this research I used all Men’s Relay races on the IBU World cup, World championships and Olympic Games since the 2000-2001 season, ending at the 5th event of the current 2021-2022 season. I removed all nations that did not start, did not finish, got lapped, etc. Then I did some conversions of times from hours, minutes and seconds into seconds and did data validation as some years had some bad data quality in some fields.

Measures

Then the question was how to measure the narrowing of the field in biathlon. I took a two-sided approach on this: for one I looked at how many seconds the 15th ranked team was behind the eventual winners of the race. This should give me a good idea of how much the weaker teams are behind the top team, expressed in time. The other approach was to see how many teams finished within 5 minutes of the winning team. This gave me another look at how many teams could be considered stronger teams.

The 15th rank and the 5 minutes are variables that can be debated forever. But the reasoning for the 15th team is that in many cases there weren’t that many more teams in the race that finished. The 5 minutes is an arbitrary number I decided on after spending some time going through the data and looking at the distance in time between the better teams of the time.

Analysis

As one would expect, due to different venues, weather conditions, team lineups and other factors, the results are kind of up and down from one race to the next.

Seconds behind lead for rank 15
Nations with 5 minutes of winning team

Although we can kind of see some vague hints of a trend in the second chart, it really doesn’t show it at a level that would make me comfortable to claim a trend exists.

Luckily we can use the moving average function. For every race, this takes the race’s result plus the previous 10 races (about two seasons worth) and averages them. This gives a clearer picture and a better idea of the trends over the last two decades.

Results

The first chart, about the time behind the leaders for teams ranked 15th, shows that despite some waves going up and down, over time the time behind the leaders has slowly but steadily decreased, from about 500 seconds to between 250 and 300 seconds. That means the 15th ranked teams have gotten 3 to 4 minutes closer in the last 20 years.

The second chart, with the number of nations within 5 minutes from the winning team, shows an even more wavy pattern. Since about 12-15 seasons ago, the general number of teams has been going up, ranging between 13 and 16, but from there it seems to have stabilized.

Overall, I think the “smaller” biathlon nations are getting closer to the leaders of the pack, but the number of top nations appears to have stabilized in the last 5-10 years. What do you think? Would other ranks and seconds from the winner values be better to use for this analysis? Please let me know on Twitter or use the interactive version of this chart and see for yourself!

Posted in Long-term trends, Statistical analysis

And we continue our Shot data analysis

Posted on 2022-01-15 | by biathlonanalytics | Leave a Comment on And we continue our Shot data analysis

I did some further analysis looking at the shooting data, based on more feedback and discussion on Twitter yesterday.

Again, I started with the 5 seasons of shooting data, men and women, with the current season up to the 5th event. I then filtered for Mass Starts and Pursuits, and did some data cleaning, leaving 96,580 shots for the analysis, not limiting the data by certain ranks only.

Question 1

Aldo Ramos on Twitter wondered if we could determine the percentages of athletes that would go clean on the first 15 shots, and then had one miss. And where did that miss happen?

After moving the data back and forth between Tableau and Google Sheets, I was able to show what percentage of athletes clean on the first 15 missed their 16th target, or went clear on the first 16 and missed the 17th target, etc.

For clarity’s sake, the T16 column includes MHHHH, MMHHH, MMMHH, etc. The question was really about at what shot the “Clean spell” is broken. As athletes pick up more misses as the fifth shooting goes on, the percentages go down. Other than going clean on all 20, which 41% of the athletes clean after 15 achieve.

Question 2

Bjorn then asked on Twitter how many athletes missed more than one shot in the last shooting.

The chart above shows all sequences of the last 5 shots. As we saw above 41% goes clean all the way, after that the most common occurrence is missing the 16th shot, then missing shot 20 with 8.44%, etc.

But it doesn’t really clearly answer Bjorn’s question of how many misses in the last five were shot. The chart below answers that question more clearly:

Just over 40% went clear, and the same percentage had one miss. The group with two misses was 15%, three misses 2.5% and just over 1% missed four times. No one in the group that hit the first 15 shots had 5 misses in the last shooting.

Posted in Statistical analysis

A continued exploration of shot data

Posted on 2022-01-14 | by biathlonanalytics | Leave a Comment on A continued exploration of shot data

Introduction

I had a fun discussion with Bjorn Ferry, Biathlon23 and SportInDepth on Twitter. We debated if taking the 4th and 5th shot after shooting clean on the first three, is (mentally) harder than when you already have a miss in your first three shots.

After presumably reading my article Is one shot like any other in biathlon Bjorn sent the following chart and messages:

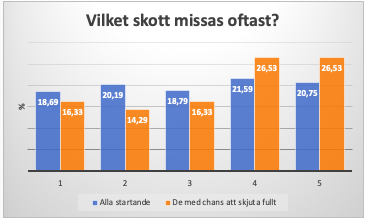
My thesis is that the last shot is difficult only if you did not miss earlier in the competition. If you only look at those who hit the first 9 shots on a sprint, I think the last shot has bad statistics. But not for those who missed already in prone.

I went through the individual and the sprint competitions in Pokljuka back in 2018 to find out if it is the case that the last shot is more difficult. I compared all shooting series (6410 shots) with those that arrived to the last standing with the chance to shoot clean.->

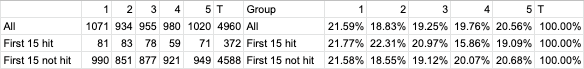
Shot 1,2,3,4,5; which is most often missed? For the entire starting field it was no clear tendency to miss shots four or five more often. For the group that arrives to the last stand with the chance to shoot clean, it becomes clear that shots four and five are harder. ->

It is also logical because then you have the chance to make a really good result. The pressure is increasing. *whole field = blue bars those with the chance to shoot full = orange bars

It would be fun to see if this is true if you look at an entire season. If you hit the first 8 targets in a sprint, or the first 18 targets in the other disciplines. What does it look like then? I think the fourth and fifth shots are harder.

Caveat

Before I continue, I want to be very clear. One, I am not a statistician, and two, Bjorn probably knows a little more about biathlon than I do, based on his 7 wins and 22 top-3’s in the IBU World Cup, World Champs and Olympics, not even counting his 7 medals in relays. So to go out and say I did not agree with his findings was, well scary.

Data

My data however told me a slightly different story. We also started with different datasets. His data was from the individual and sprint competitions (not sure if it includes men and women) in Pokljuka in 2018 only looking at the final standing shooting, for 6410 shots. Mine was from the 2017-18 season onwards to the Oberhof event in 2021-22. It includes the final standing shooting of the Sprint, Pursuit, Mass Start and Individual events. I also only included the top 30 athletes. And 6,410 shots -vs- 31,419 will make a difference. Not better or worse, but less influenced by outliers, and more predictable.

I did not have the data in a format where I could replicate the chart from Bjorn, so initially I took a different approach in my analysis.

Analysis, approach one

The chart shows the number of hits and misses per shot of the last shooting of an event (so 2nd shooting for Sprint, and 4th shooting for the other events). As shown in the previous article, the first and last shots have the lowest hit rates.

This data can be copied from Tableau to Google sheets where I can create a table that shows the probability for every shot combination.

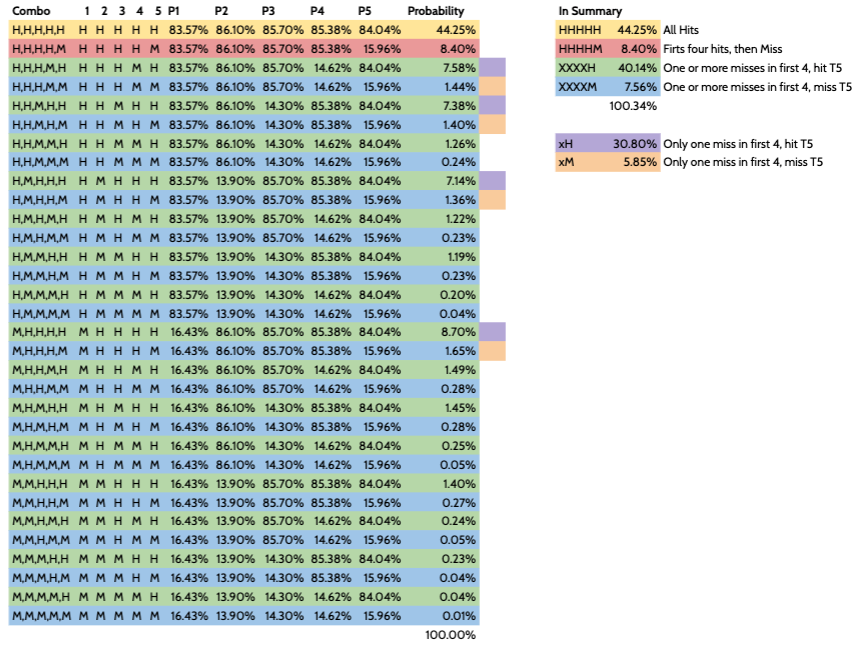
Now that we have a list of probabilities for every shot combination, we can group these combinations into:

CombiProbability
  • All hits
  • 44.3%
  • First 4 hits, miss T5
  • 8.4%
  • One or more misses in first 4, hit T5
  • 40.1%
  • One or more misses in first 4, miss T5
  • 7.6%

    So hitting the fifth target after hitting the first four targets has a higher probability than when missing one or more targets in the first four shots. This conclusion is different from the conclusion Bjorn drew from his chart, but perhaps this is simply because I didn’t replicate the chart he used.

    Analysis, approach two

    To compare apples to apples I want to duplicate the chart from Bjorn. First, I used a different subset. Still from the same seasons, I included all athletes rather than the top 30 only. I also limited the data to only Mass Starts and Pursuits to limit the number of records (Goole Sheets crashed with more than one million cells). Also, these race disciplines probably have even more pressure, since it (wo)man to (wo)man rather than time-based. This left me with 107 races and 358 athletes for 98,400 shots.

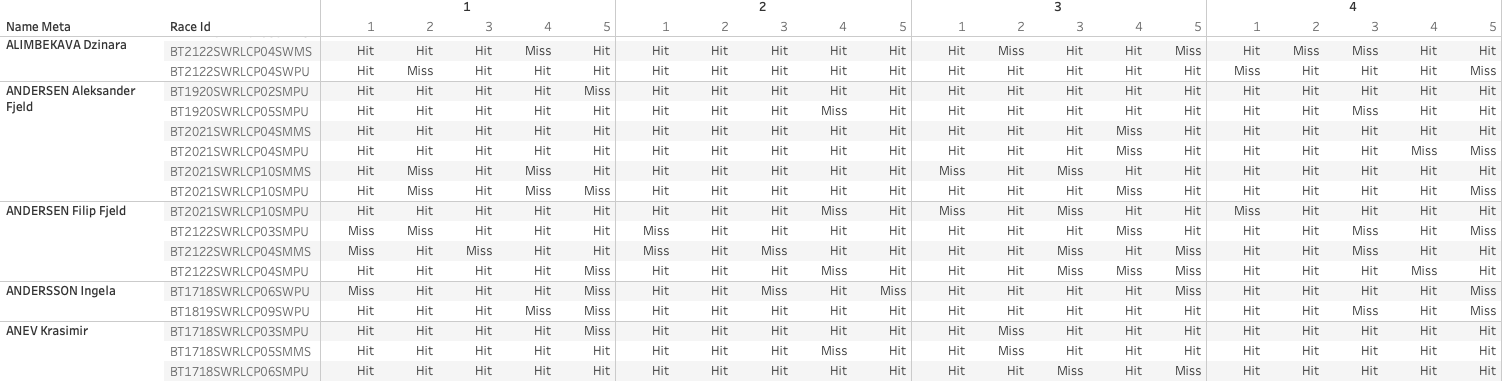
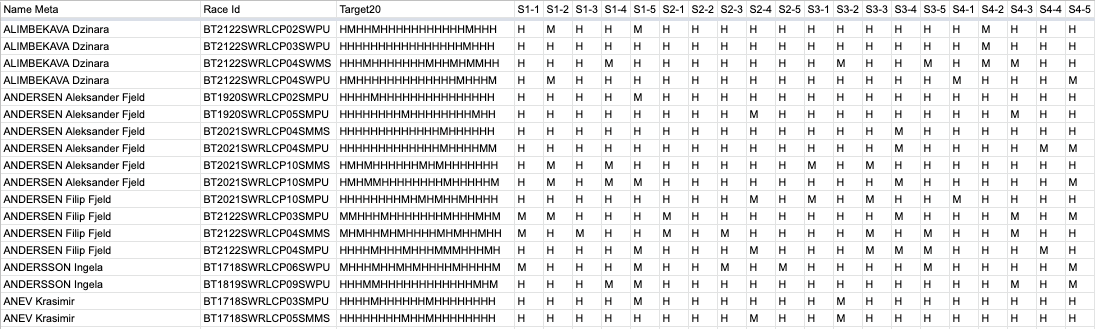
    I moved this data over to Google Sheets where I could use the Pivot functionality to create the following table with Athlete, Race and shot full (20 shot) combination, in which the M indicates a miss and H a hit:

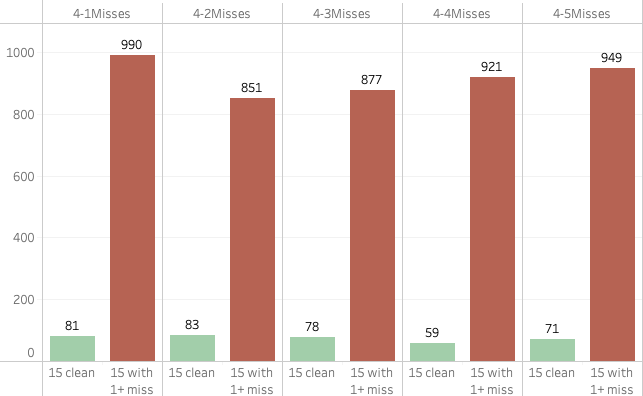
    Going back to Tableau, I could now calculate the misses for every shot of the fourth (and last) shooting session, and create two groups of athletes: one that started the fourth shooting with 15 hits, and one that had at least one miss in the first 15 shots.

    Going back and forth

    Unfortunately, the way the data is formatted I could not convert this data to a percentage, so back to Google sheets I went to create a conversion table, which I then could use to create the chart similar to Bjorn’s.

    When I display the percentages for the group of all athletes as well as those that came into the fourth shooting with zero misses, again the conclusion that can be drawn is different from Bjorn.

    Let’s quickly put them side by side again to compare:

    It is clear why Bjorn felt his data and chart are supporting his thesis that shooting targets 19 and 20 is harder when you go clean in the first 15 shots, compared to when you have a miss already. And I do agree with him that if you think about it would make sense. But no matter how I look at my data, I cannot come to the same result. The fourth shot is actually missed the least and the fifth is missed less often than shots one, two or three. Of course, for the fifth shot, this includes both those who shot clean the first 15 and then missed one or more shots in the final shooting.

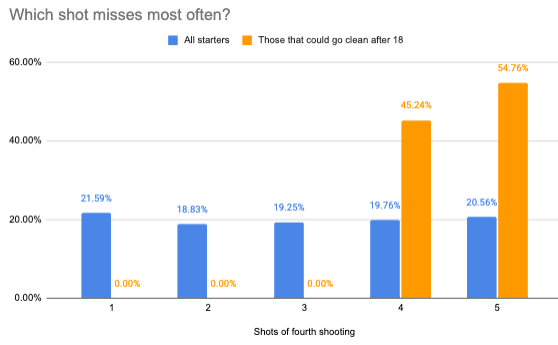
    First 18 shots clean

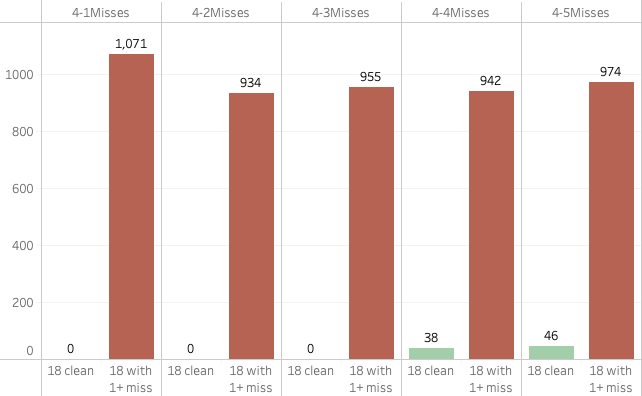
    So what if we look at those shootings where the first 18 were clean? I basically did the same exercise adding up the misses per group in Tableau. Obviously the first three shots have no misses since the first 18 are clean. That doesn’t leave us with much data, with only 84 misses in total on the fourth and fifth shots.

    Again we bring this over to Google sheets and calculate the percentages.

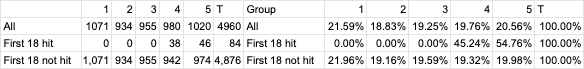
    From there we create a chart, from which I conclude that if anything the fifth shot is harder than the fourth, confirming our earlier finds that the first and last shots of a shooting are the hardest. But to draw any conclusions based on 84 shots only is not something would recommend.

    Conclusion

    From the chart I created, I cannot conclude that the 4th and 5th shots are harder when clean, compared to when one already has a miss. If anything, it seems there are fewer misses in shots four and five of the last shooting when one is clean.

    One of the reasons I mentioned on Twitter is that if you make it to the fourth shooting without any misses, you are a pretty darn good shot. The odds of making the next five shots are pretty good. On the other hand, if you already had one or more misses in the first fifteen, perhaps you still have some work to do on the shooting, and having another miss is not an unrealistic expectation. We need to remember that this includes all athletes from Pursuits and Mass Starts, so up to 60 per race. That includes shooters who can use some improvement still, as well as the Laegreids and Eders of biathlon who shoot around 90%.

    How else can we explain the differences? The last thing I want is to create the impression that I think I know better than Bjorn Ferry, and that his chart is wrong. This is not the case (to be clear)! Just the fact that my resulting chart does not support the thesis Bjorn stated makes me nervous, especially as he mentioned his chart confirms what he expected. Someone with his experience of course knows what he is talking about. But my data and analysis don’t live up to these expectations…

    I mentioned I’m not a statistician, and although I double and triple checked my data and process, so I’m confident there are no mistakes in the data or process. But if anyone can tell me after reading this article that I went wrong I’d be happy to hear from you!

    Another reason I believe there are different results is that both analyses are based on using different data sources and sample sizes. I should also mention that I don’t know the details of the process that Bjorn used to create his chart. Perhaps I misunderstood what he did and used, which may have led to doing a different analysis. The larger sample size I used typically leads to less obvious differences and fewer extremes And Bjorn used data from one event with a couple of races, which will make it subjective to conditions specific to Pokljuka. Something levelled out by using more data from different event locations with different weather conditions.

    All in all, it was great fun and interesting to do this analysis, and I thank Bjorn Ferry for reaching out and sharing his chart and work. Although my work does not support his thesis, I hope this article hasn’t lost me a follower on Twitter… ;o)

    Let me know what you think about this article by sending me a Tweet or DM! Any feedback is highly appreciated.

    Posted in Statistical analysis

    Olympic medals in biathlon (1960 – 2018)

    Posted on 2022-01-12 | by real biathlon | Leave a Comment on Olympic medals in biathlon (1960 – 2018)

    All medals (men and women)

    Individual gold medals (men and women)

    Posted in Biathlon Media, Long-term trends | Tagged results

    Posts navigation

    Older posts

    Recent Articles

    • Most improved athletes this winter
    • New biathlon point system
    • Historic biathlon results create expectations. But what about points?
    • What do you expect? Practical applications of the W.E.I.S.E.
    • Introducing W. E. I. S. E: the Win Expectancy Index based on Statistical Exploration, version 1

    Categories

    • Biathlon Media
    • Biathlon News
    • Long-term trends
    • Statistical analysis
    • Website updates

    Archives by Month

    • 2022: J F M A M J J A S O N D
    • 2021: J F M A M J J A S O N D
    • 2020: J F M A M J J A S O N D
    • 2015: J F M A M J J A S O N D
    • 2013: J F M A M J J A S O N D
    • 2012: J F M A M J J A S O N D

    Search Articles