real biathlon
    • Athletes
    • Teams
    • Races
    • Seasons
    • Scores
    • Records
    • Blog(current)
    • More
      Patreon Content Course Profiles Explanations Shortcuts
      Error Report
      Privacy Policy About
    •     
  • Forum
  • Patreon
  • Twitter
  • YouTube
    Instagram
    Facebook

Recent Articles

  • Most improved athletes this winter
  • New biathlon point system
  • Historic biathlon results create expectations. But what about points?
  • What do you expect? Practical applications of the W.E.I.S.E.
  • Introducing W. E. I. S. E: the Win Expectancy Index based on Statistical Exploration, version 1

Categories

  • Biathlon Media
  • Biathlon News
  • Long-term trends
  • Statistical analysis
  • Website updates

Archives

  • 2022
    • December
    • June
    • May
    • March
    • February
    • January
  • 2021
    • December
    • November
    • September
    • July
    • June
    • May
    • April
    • March
    • February
    • January
  • 2020
    • December
    • November
    • August
    • June
    • March
  • 2015
    • December
  • 2013
    • August
    • July
  • 2012
    • July

Search Articles

Recent Tweets

Tweets by realbiathlon

Month: March 2022

Most improved athletes of last season

Posted on 2022-03-28 | by real biathlon | Leave a Comment on Most improved athletes of last season

Improvements in Total Performance Scores of regular World Cup athletes season-to-season. The last row of both tables shows changes in overall scores for the 2021โ€“22 season compared to performances one season earlier (only athletes who appeared in at least half the races each season). You can do your own season-to-season comparisons for all stats in the Patreon bonus area.


Note: The scores are standard scores (or z-scores), indicating how many standard deviations (SD) an athlete is back from the World Cup mean (negative values indicate performances better than the mean). The Total Performance Score is calculated by approximating the importance of skiing, hit rate and shooting pace using the method of least squares (for more details, see here and here), and then weighting each z-score value accordingly.


Men

2021โ€“22 z-Scores compared to 2020โ€“21 | Non-Team events

Winning his first top 10 result this season, American Paul Schommer was the most improved male athlete, with career bests both in terms of shooting accuracy and ski speed. Vytautas Strolia also managed his first career top 10 this winter, coming second on this list, mostly thanks to skiing almost 2% faster than last year. In contrast, Martin Ponsiluoma and Sturla Holm Lรฆgreid both underperformed compared to 2020โ€“21, even though Lรฆgreid managed to finish the season strong and repeated his 2nd place in the overall standings.

Quentin Fillon Maillet only improved marginally over last winter (1.3% better hit rate, 0.5% faster skiing), but it was more than enough to win his first Overall World Cup title comfortably. Johannes Thingnes Bรธ had by far the worst shooting stats of his career (82.1% hit rate, a whole 10% lower than only two seasons ago), however, he was still the field’s fastest skier and he delivered when it counted most in Beijing, winning 4 Olympic gold medals.

2021โ€“22 z-Scores compared to 2020โ€“21 | Non-Team events

NoFamily NameGiven NameNationRacesSki Speed
Score
Hit Rate
Score
Range Time
Score
Total
Performance
Score
Change
NoFamily NameGiven NameNationRacesSki Speed
Score
Hit Rate
Score
Range Time
Score
Total
Performance
Score
Change
1SchommerPaulUSA
18-0.18-0.68-0.35-0.35-0.45
2StroliaVytautasLTU
23-0.67-0.51-0.15-0.56-0.35
3DudchenkoAntonUKR
14-0.65-0.810.59-0.55-0.27
4SmolskiAntonBLR
19-1.19-0.690.20-0.88-0.22
5FemlingPeppeSWE
14-0.44-0.81-0.95-0.61-0.21
6LatypovEduardRUS
14-1.34-0.62-0.28-1.01-0.21
7SeppalaTeroFIN
25-1.03-0.50-0.45-0.80-0.19
8KuehnJohannesGER
21-1.210.02-0.03-0.71-0.18
9ChristiansenVetle S.NOR
24-1.24-1.24-0.52-1.15-0.17
10KobonokiTsukasaJPN
20-0.09-1.04-0.11-0.37-0.14
11LesserErikGER
20-1.01-1.21-1.44-1.12-0.14
12ReesRomanGER
25-0.75-1.25-0.17-0.82-0.11
13Fillon MailletQuentinFRA
26-1.55-1.19-1.01-1.38-0.09
14BormoliniThomasITA
25-0.58-0.66-0.60-0.60-0.09
15BrownJakeUSA
19-0.80-0.000.71-0.39-0.08
16ClaudeFabienFRA
24-1.17-0.10-1.00-0.84-0.07
17LangerThierryBEL
14-0.32-0.340.26-0.25-0.06
18GowScottCAN
16-0.45-0.23-1.10-0.46-0.05
19StvrteckyJakubCZE
18-0.830.680.84-0.19-0.05
20DollBenediktGER
25-1.28-0.63-0.45-0.99-0.04
21WegerBenjaminSUI
18-0.76-1.24-0.32-0.85-0.03
22LeitnerFelixAUT
23-0.67-0.80-0.31-0.66-0.02
23GuigonnatAntoninFRA
21-0.90-0.39-0.92-0.75-0.01
24SamuelssonSebastianSWE
24-1.44-0.62-0.54-1.09+0.02
25DesthieuxSimonFRA
26-1.18-0.81-0.51-0.99+0.02
26GowChristianCAN
18-0.18-1.24-1.00-0.58+0.03
27DovzanMihaSLO
15-0.06-0.78-1.16-0.40+0.06
28LoginovAlexandrRUS
18-1.41-0.26-0.14-0.92+0.08
29PidruchnyiDmytroUKR
14-0.91-0.07-0.20-0.58+0.09
30BoeTarjeiNOR
22-1.31-0.92-0.28-1.07+0.09
31BionazDidierITA
14-0.33-0.190.81-0.16+0.09
32ZahknaReneEST
150.34-0.720.02-0.00+0.10
33NelinJesperSWE
17-0.900.370.38-0.38+0.11
34JacquelinEmilienFRA
25-1.28-0.44-1.04-1.01+0.11
35IlievVladimirBUL
18-0.880.590.48-0.29+0.13
36KrcmarMichalCZE
25-0.79-0.660.01-0.65+0.14
37ClaudeFlorentBEL
20-0.24-0.530.24-0.27+0.14
38EderSimonAUT
25-0.57-1.31-1.19-0.86+0.14
39BoeJohannes T.NOR
17-1.78-0.40-0.28-1.20+0.21
40LaegreidSturla HolmNOR
23-1.35-0.90-0.90-1.17+0.22
41PonsiluomaMartinSWE
23-1.390.59-0.86-0.75+0.22
42DohertySeanUSA
21-0.430.26-0.36-0.22+0.24
43WindischDominikITA
18-0.770.490.00-0.31+0.24
44MukhinAlexandrKAZ
15-0.110.740.980.26+0.24
45HoferLukasITA
24-0.82-0.96-0.30-0.80+0.28
46GuzikGrzegorzPOL
140.160.910.540.42+0.30
47SimaMichalSVK
150.190.120.210.17+0.30
48KomatzDavidAUT
18-0.05-0.800.51-0.20+0.34
49SinapovAntonBUL
130.011.040.960.42+0.57

Women

Jessica Jislovรก was the most improved athlete on the women’s side, skiing roughly 1% faster than last season and raising her non-team hit rate by 13.9% (among regular World Cup athletes, she was the 4th-most accurate overall). She is followed by Deedra Irwin, who managed the United States’ best ever non-team result in Olympic history, and Sweden’s Anna Magnusson, who got her stats almost back to her 2016โ€“17 level, her career best season.

While Marte Olsbu Rรธiseland did improve over last winter (-0.2%), her performance uptick wasn’t as extreme as you might expect. Last year’s World Cup winner Tiril Eckhoff was worse, but according to this metric only marginally (+0.1%); in fact, her hit rate didn’t change much at all (-2.1%). Clearly, it’s sometimes more important when you miss your shots, not so much how you average out over a season.

2021โ€“22 z-Scores compared to 2020โ€“21 | Non-Team events

NoFamily NameGiven NameNationRacesSki Speed
Score
Hit Rate
Score
Range Time
Score
Total
Performance
Score
Change
NoFamily NameGiven NameNationRacesSki Speed
Score
Hit Rate
Score
Range Time
Score
Total
Performance
Score
Change
1JislovaJessicaCZE
25-0.59-1.11-0.49-0.73-0.62
2IrwinDeedraUSA
19-0.33-0.510.32-0.31-0.54
3MagnussonAnnaSWE
16-0.84-0.40-0.51-0.67-0.52
4LieLotteBEL
22-0.39-1.03-0.87-0.63-0.44
5OebergElviraSWE
24-1.79-0.51-1.06-1.33-0.42
6SolaHannaBLR
18-1.620.28-1.10-1.01-0.41
7BrorssonMonaSWE
21-1.00-0.70-0.83-0.89-0.40
8FialkovaIvonaSVK
19-1.060.66-0.26-0.47-0.39
9ChevalierChloeFRA
20-1.14-0.17-0.28-0.76-0.34
10MinkkinenSuviFIN
17-0.10-1.21-0.78-0.50-0.27
11Braisaz-BouchetJustineFRA
25-1.840.42-0.50-1.02-0.26
12TodorovaMilenaBUL
18-1.020.19-0.00-0.55-0.26
13Chevalier-BouchetAnaisFRA
24-1.22-0.51-1.48-1.05-0.26
14RoeiselandMarte OlsbuNOR
24-1.66-1.09-1.34-1.45-0.20
15AlimbekavaDzinaraBLR
19-1.39-0.77-0.49-1.10-0.19
16TomingasTuuliEST
18-0.66-0.160.45-0.39-0.18
17SimonJuliaFRA
25-1.27-0.13-1.74-0.99-0.17
18TachizakiFuyukoJPN
18-0.26-0.650.20-0.32-0.15
19KlemencicPolonaSLO
17-0.200.48-0.060.02-0.15
20BescondAnaisFRA
25-1.25-0.07-0.20-0.78-0.15
21MaedaSariJPN
15-0.760.960.43-0.12-0.12
22OjaReginaEST
16-0.090.21-0.60-0.06-0.08
23NigmatullinaUlianaRUS
18-1.01-0.50-0.14-0.76-0.08
24TandrevoldIngrid L.NOR
23-1.31-0.70-0.18-1.00-0.08
25HerrmannDeniseGER
23-1.55-0.34-0.18-1.04-0.08
26EderMariFIN
24-1.300.520.51-0.56-0.07
27OebergHannaSWE
24-1.560.03-1.79-1.13-0.05
28HettichJaninaGER
16-0.88-0.44-0.82-0.75-0.05
29GasparinAitaSUI
13-0.39-0.58-1.09-0.53-0.05
30EganClareUSA
18-0.63-0.350.11-0.46-0.05
31GasparinElisaSUI
13-0.48-0.20-1.00-0.46-0.04
32DavidovaMarketaCZE
25-1.41-0.46-0.20-0.99-0.03
33PerssonLinnSWE
22-1.23-0.30-0.57-0.89-0.03
34MironovaSvetlanaRUS
15-1.07-0.19-0.21-0.72-0.02
35KazakevichIrinaRUS
18-1.020.170.49-0.49-0.00
36HauserLisa TheresaAUT
26-1.10-0.81-1.53-1.06+0.00
37CharvatovaLucieCZE
20-0.930.77-0.23-0.36+0.01
38VittozziLisaITA
20-1.050.96-1.40-0.51+0.04
39HaeckiLenaSUI
22-0.88-0.09-1.24-0.69+0.04
40AvvakumovaEkaterinaKOR
13-0.34-0.150.86-0.14+0.05
41ReidJoanneUSA
16-0.520.420.12-0.17+0.09
42PreussFranziskaGER
17-1.35-0.58-0.76-1.06+0.09
43KruchinkinaElenaBLR
13-0.700.190.26-0.33+0.09
44ZukKamilaPOL
14-0.790.680.42-0.22+0.10
45KnottenKaroline O.NOR
18-0.41-0.60-1.80-0.63+0.10
46LeshchankaIrynaBLR
14-0.79-0.070.77-0.40+0.10
47EckhoffTirilNOR
21-1.70-0.22-0.77-1.16+0.11
48HinzVanessaGER
21-0.80-0.53-0.02-0.63+0.11
49PuskarcikovaEvaCZE
160.00-0.31-0.65-0.17+0.12
50WiererDorotheaITA
25-1.08-0.46-1.46-0.95+0.15
51Hojnisz-StaregaMonikaPOL
19-0.74-0.58-0.09-0.61+0.19
52ZdoucDunjaAUT
13-0.04-0.95-1.27-0.45+0.20
53BendikaBaibaLAT
19-0.820.33-0.39-0.44+0.22
54LienIdaNOR
19-1.240.710.22-0.50+0.24
55LunderEmmaCAN
17-0.26-0.21-1.46-0.39+0.29
56DzhimaYuliiaUKR
19-0.990.14-0.10-0.55+0.30
57DunkleeSusanUSA
150.03-0.020.290.04+0.38
58SchwaigerJuliaAUT
14-0.37-0.280.60-0.23+0.38
59GasparinSelinaSUI
15-0.690.73-0.07-0.20+0.48
60TalihaermJohannaEST
140.29-0.240.540.17+0.49
Posted in Statistical analysis

Who were the best performing biathletes at the Beijing Olympics?

Posted on 2022-03-02 | by biathlonanalytics | Leave a Comment on Who were the best performing biathletes at the Beijing Olympics?

Introduction

This article accompanies the Tableau Public dashboards I created to highlight those athletes who performed better than their season average at the Olympic Winter Games in Beijing, and look at those below their average.

Data

The data used for this analysis are all from the race analysis reports from the non-team IBU races in the 2021-2022 season up to and including the Olympic Winter Games in Beijing. The data was then split into two groups. The Olympic Games races, and the races during the first two trimesters of the season. After averaging the performances per group, the two groups were then compared.

I would like to note that the data for the Olympic games is based on four races or less. This is a very small sample size to use for averages that show Olympic performances. While some of these performance differences can be explained by (bad) luck on an individual level, at the nation or gender level the averages will eliminate or at least significantly reduce this luck factor.

Performances

This analysis looks at which athletes over- or underperformed compared to their statistics in the first two trimesters of the IBU World Cup, rather than at their overall performance at the Olympics. For example, while Justine Braisaz-Bouchet went home with a gold medal, on average she was slower and shot a lower percentage than her first two trimesters.

The Skiing performance is expressed in the average seconds behind the leader per 1,000m. The calculation uses the total course length as provided on the IBU Biathlonresults.com webpage. Please note that by using this metric we also get a sense of how much the field was spread out, as it looks at the seconds behind the leader.

The Shooting performance uses the average total shooting percentage (prone and standing combined).

As the values for both skiing and shooting performances differences were in the same range I added a Combined difference of the two. A negative skiing performance and positive shooting performance are considered improvements. Therefore the calculation is [Shooting performance] – [Skiing performance].

Field

Before jumping into the individual results it is a good idea to look at the averages for men (blue circle), women (orange triangle) and everyone combined:
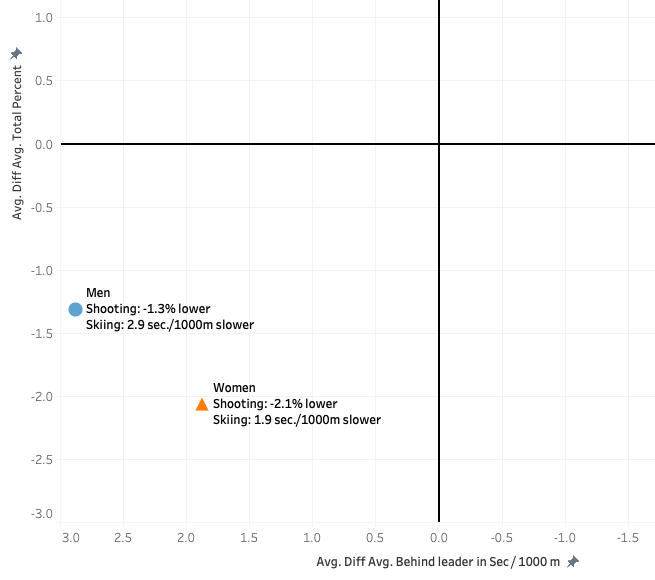
From these numbers, we can assume that both the skiing conditions as well as the shooting conditions were tougher than the average conditions during the first two trimesters as all athletes combined were (on average) 2.4 sec./1,000m slower and shot 1.7% worse. This aligns with what we have seen and read about the Olympic races being very tough.

Tableau dashboards

I encourage you to have a look at the table and charts on Tableau Public page I created for this analysis. It allows you to filter the data and will show you additional information by hovering over the data points. It will also allow you to see more details and information than described below. The screenshots used in this article are taken from the same dashboards.

Link to Tableau Public page

Men

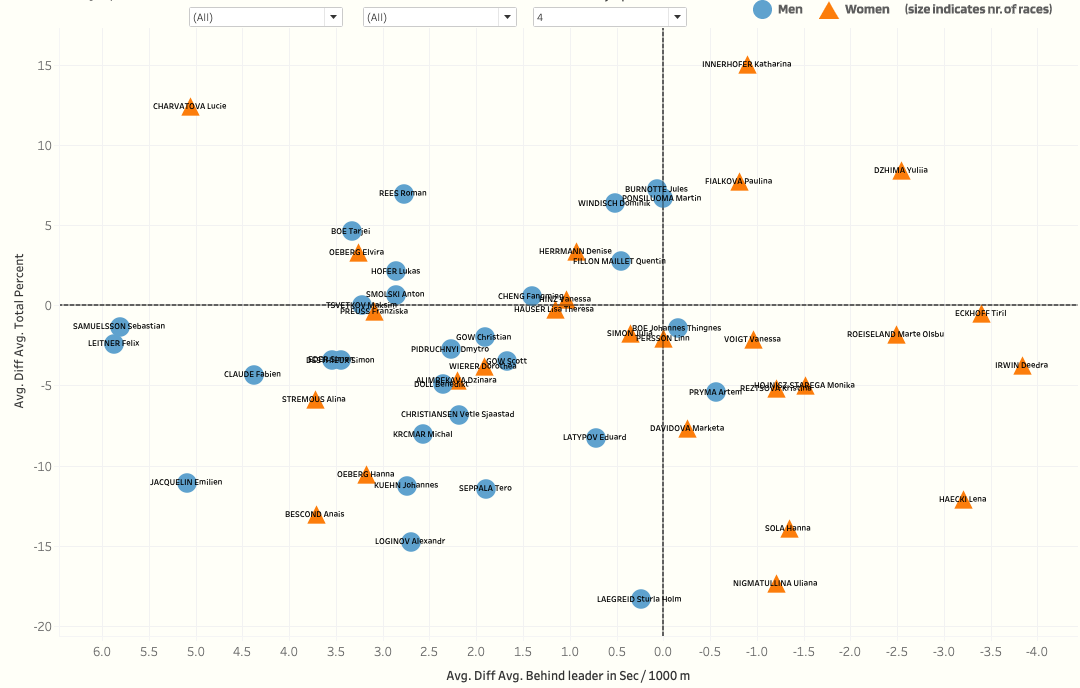
When looking at the men’s performances for all athletes that raced all four non-team events (you can change this in the interactive dashboards), the Canadian Jules Burnotte had the best performance improvement during the Olympics. He had basically the same ski speed and shot 7.25% higher than in the first two trimesters. Martin Ponsiluoma, Dominik Windisch, Roman Rees, Quentin Fillon Maillet and Tarjei Boe were also better (on average) compared to their first two trimesters.

Sturla Holm Laegreid on the other hand had the worst performance, seeing his shooting percentage drop by over 18% and skiing just a tiny bit slower. Emilien Jacquelin and Alexandr Loginov probably also had hoped for better individual performances.

There were only two male athletes with four races that improved their skiing performance: Artem Pryma from Ukraine, and Johannes Thingnes Boe from Norway. And they only shaved off 0.6 and 0.2 seconds per 1,000m respectively (but keep in mind the average for men was 2.9 seconds/1,000m slower). Emilien Jacquelin, Sebastian Samuelsson and Felix Leitner lost the most speed, with more than five seconds/1,000m.

When looking at all athletes, regardless of how many races they participated in, Raido Raenkel from Estonia (3 races) was 1.14 sec./1,000m slower but shot 17.5% better, for a combined improvement of 16.36, the best of the field. He was closely followed by Matej Baloga and Sebastian Stalder.

Women

On the women’s side, the best performance improvement came from Katharina Innerhofer from Austria (only including athletes with all four races). She was almost a second faster and shot 15% better. Yuliia Dzhima, Paulina Fialkova, Lucie Charvatova, Tiril Eckhoff, Denise Herrmann, Marte Olsbu Roeiseland, Deedra Irwin and Elvira Oeberg were the other female athletes who improved compared to the first two trimesters.

Hanna Oeberg, Uliana Nigmatullina and Anias Bescond had the largest combined decrease in performance.

There were actually 13 athletes who improved their skiing performances during the Olympics, with not the much-discussed athlete Tiril Eckhoff making the biggest improvement, but Deedra Irwin (3.8 sec./1,000m) from the USA. Lucie Charvatova on the other hand lost just over 5 sec./1,000m.

The same Charvatova, and Kathariana Innerhofer improved their shooting the most, by 12.4 and 15% respectively, while Anias Bescond, Hanna Sola and Uliana Nigmatullina had the biggest drop in shooting percentage (13, 14 and 17.3%).

For all athletes, ignoring the number of races they participated in, the best improvement was by Maria Zdravkova from Bulgaria (2 races), who was 0.45 sec./1,000m faster and shot 17.5% above her pre-Olympic season average. Innerhofer (4 races) and Erika Janka from Finland (1 race) were close behind.

The athletes in the top right corner improved both in skiing and shooting. The bottom left corner has a decrease in both:
Nations

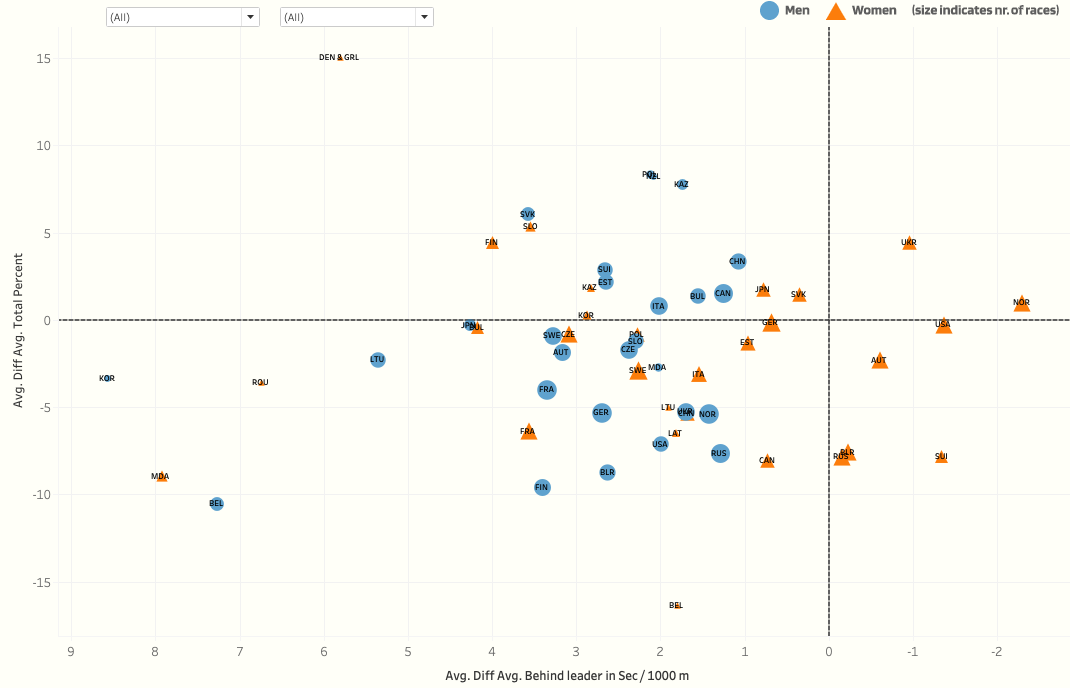
The performance improvement results for nations, split by gender, are based on all athletes that participated for a nation in non-team events, regardless of the number of races they participated in. This should be kept in mind when looking at nations like Denmark&Greenland women and New Zealand men (2 races total for both), or Sweden (women) and Germany (men) with 16 races. For the following paragraphs, I only looked at nations that had 8 or more races in total (half of the max. number of races possible).

Since we are only looking at the nation’s average, the results don’t say anything about how spread out the individual results were within the team, and this can strongly vary between teams. The averages were calculated by averaging all the nation’s athlete’s race results, rather than averaging the athlete’s averages per nation and gender.

Women

The top 6 nations on the women‘s side all had an improvement: Ukraine, Norway, Slovakia, USA, Japan and Finland. All other nations had a decrease in combined performance, with France having the worst combined performance improvement followed by Canada, Russia, Belarus and China. Norway improved most in skiing, and Ukraine in shooting.

Men

Moving over to the men‘s side, there were only four nations that improved on their combined performance: Slovakia, China, Canada and Switzerland. The worst combined performances were from Belgium, Finland, Belarus, USA and Russia. The biggest improvers in skiing were China, Canada, Russia and Norway, while Slovakia, China Switzerland, Estonia, Canada, Bulgaria and Italy were the only nations that improved their shooting performance.

When we look at a combined overview we can see that overall women made bigger improvements than men:
Again, I encourage you to check out these visuals interactively on Tableau Public, specifically the ones used above: Athletes Table, Athletes Chart and Nations Chart.

Cheers!

Posted in Statistical analysis | Tagged Beijing 2022, Olympic Winter Games

Recent Articles

  • Most improved athletes this winter
  • New biathlon point system
  • Historic biathlon results create expectations. But what about points?
  • What do you expect? Practical applications of the W.E.I.S.E.
  • Introducing W. E. I. S. E: the Win Expectancy Index based on Statistical Exploration, version 1

Categories

  • Biathlon Media
  • Biathlon News
  • Long-term trends
  • Statistical analysis
  • Website updates

Archives by Month

  • 2022: J F M A M J J A S O N D
  • 2021: J F M A M J J A S O N D
  • 2020: J F M A M J J A S O N D
  • 2015: J F M A M J J A S O N D
  • 2013: J F M A M J J A S O N D
  • 2012: J F M A M J J A S O N D

Search Articles