Guest Essay by Dan Covaciu
How Johannes Thingnes Boe can claim the status of the Greatest Biathlete of All Time?
The current layout of the Biathlon GOAT debate
There are few sporting discussions that are more debated and polarizing than Greatest of All Time (GOAT) conversations. In many disciplines, like basketball with the LeBron James – Michael Jordan discussion, there are analysts, fans, and even athletes themselves presenting their position on such a topic. However, every once in a while, an athlete comes out of the pack in such a dominant fashion, with remarkable longevity that it gets sporting minds questioning their position in all-time rankings. Such a case is the Norwegian Johannes Thingnes Boe, a 29-year-old biathlete from Stryn. Throughout his 10-year senior career, the Markane IL athlete has won multiple World Cup titles, with many international, World, and Olympic Titles to complete an impressive resume. His skiing speed has been a staple of his dominance for years, while his shooting has been up-and-down, with some superb performances, surrounding other inconsistent results in the range. JT has been at the top of his sport for more than half a decade, he has imposed himself in many ways, yet he may not be the GOAT in many people’s books. That is due to the impacts that Ole Einar Bjoerndalen and Martin Fourcade have had on the sport. Before delving more into the data, the outlook of this battle has JT in 3rd currently, in my books. Consequently, we will be analysing the results and steps he still has to reach GOAT status before retiring and focusing on his family and life outside of biathlon.
First Candidate – Ole Einar Bjoerndalen
 Ole Einar Bjoerndalen’s World Cup results per season
Firstly, it is time to meet the two men who are in JT’s way of being the GOAT of male biathlon. Starting with, the one and only mythical figure of biathlon, Ole Einar Bjoerndalen. Fellow Norwegian Bjoerdalen holds the record for most wins at the World Cup level, with 94, as well as the record for the most podium places at 178 rostrum appearances. His 25-year-long career had many ups and downs. However, it has changed the record books for good. He holds the record for most individual Olympic Gold medals, and most individual World Championships wins and has 6 World Cup titles to boot. Furthermore, Ole Einar also has 6-second place finishes in the World Cup Total Standings level and one 3rd place in the overall standings. Without a shadow of a doubt, the sheer numbers possessed by the mythical biathlete are the best of all time. But, numbers without context are not as telling in the discussion that we will partake in today. Still, Ole Einar still has the best longevity out of the 3 contenders. In an attempt to give some context to the raw metrics provided, let’s analyse the 10-year sample of Ole Einar’s peak to get a better understanding of how good the Norwegian was at his best.
| Name | Races | Rank (Avg) | Wins | Win% | 2nd | 3rd | Podiums | Podium% |
| Ole Einar Bjoerndalen | 472 | 11.9 | 94 | 19.9 | 53 | 31 | 178 | 37.7 |
Table 1: Ole Einar Bjoerndalen’s World Cup Career Race Statistics| Name | Total Seasons | Overall Titles | 2nd | 3rd | Discipline Titles | 2nd | 3rd |
| Ole Einar Bjoerndalen | 26 | 6 | 6 | 1 | 20 | 12 | 5 |
Table 2: Ole Einar Bjoerndalen’s World Cup Standings Statistics
 Ole Einar Bjoerndalen’s average race rank (per season)
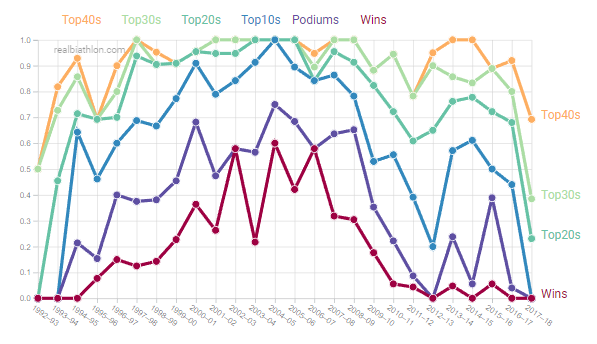
When analysing peaks, we will be looking at the average race ranking during the 10-year span and the best year of the athlete’s career. Furthermore, we will analyse the number of wins and percentage of victories taken in that span, as well as their importance. Consequently, in Ole Einar Bjoerndalen’s case, the average race ranking from 1999 to 2009 was an impressive 5.56. However, in an even more insane fashion, the best season in that analysis, the 2004-05 season, had an average rank of 2.1. That means that in most races that season Bjoerndalen was first or second. Out of 208 races in that span, the Norwegian won 79 and podiumed in 126. The winning percentage is at a stunning 37.98%, while the podium percentage raises to 60.57%. In his best season, Bjoerndalen won 60% of all his races, while podiuming in 75%. These statistics showcase how impressive his career was and why he has long been considered one of the greatest of the sport. One record that the Norwegian does not hold, however, is the record for most World Cup titles. This record stands at 7 titles and is currently in the possession of French superstar, Martin Fourcade.
Second Candidate – Martin Fourcade
 Martin Fourcade’s World Cup results per season
The French idol, Martin Fourcade has notched up 79 wins at the World Cup level in his 15-year career, with 145 podiums to boot. The biathlete from Ceret does hold the record number of World Cup Title wins as previously mentioned, but he also has the record for most Discipline Titles, at an astounding 26. Overall, out of 15 years in the sport, he finished on the podium of the World Cup in 9 of the seasons. And when looking at his performances at major events, it is unlikely we may see someone with better performances under the brightest of light. Martin has won 11 World Titles, with 7 other medals to boot, for a win percentage at the World Championship level of 30.6%. At the Winter Olympics, Fourcade has 4 gold and 6 podiums overall, for a winning percentage of 33.3%. Based on these statistics, Fourcade was supremely consistent, winning more World Cups and Discipline Titles than his rivals, with a higher win percentage in the major events. Furthermore, he has one of the best peaks the world has ever seen, but let’s take a look and observe where it stands compared to Ole Einar’s peak marks.
| Name | Races | Rank (Avg) | Wins | Win% | 2nd | 3rd | Podiums | Podium% |
| Ole Einar Bjoerndalen | 472 | 11.9 | 94 | 19.9 | 53 | 31 | 178 | 37.7 |
| Martin Fourcade | 275 | 8.2 | 79 | 28.7 | 40 | 26 | 145 | 52.7 |
Table 3: Comparison between Martin Fourcade’s and Bjoerndalen’s World Cup Career Race Statistics| Name | Total Seasons | Overall Titles | 2nd | 3rd | Discipline Titles | 2nd | 3rd |
| Ole Einar Bjoerndalen | 26 | 6 | 6 | 1 | 20 | 12 | 5 |
| Martin Fourcade | 15 | 7 | 1 | 1 | 26 | 4 | 4 |
Table 4: Comparison between Martin Fourcade’s and Bjoerndalen’s World Cup Career Standings Statistics
 Martin Fourcade’s average race rank (per season)
The 10-year selection in the career of Martin Fourcade spans from the 2010-11 season to the end of his career in 2020. Throughout his peak, the iconic Frenchman had an average race rank of 6.07. While in his best season, he reached an almost record-breaking mark of 2.2. These statistics are close, yet not quite beating Bjoerndalen’s peak results. However, if we delve deeper into the stats, Martin raced more races throughout his 10-year peak, at 241, winning 80 of them. That gives him a winning percentage of 33.19%, meaning that he won 1 out 3 races he entered in that span. In regards to podiums in that span, Martin podiumed 145 of those races, at a rate of 60.16%. Finally, in his best season, Fourcade finished with a winning percentage of 53.8%, while finishing on the podium in 84.6% of races that year – which is not even his highest mark on that statistic of his career. Overall, while Fourcade won 7 World Cups in that span, compared to “only” the 5 won by the great Ole Einar Bjoerndalen in his selected prime, I believe that these advanced numbers show one clear trend. While, the Norwegian had the slightly better peak, in terms of consistency of results, no one could overcome the French rocket that is Martin Fourcade. So, now it is time to take a look at this generation’s answer to these two greats.
This Generation’s GOAT Candidate – Johannes Thingnes Boe
 Johannes Thingnes Boe’s results per season
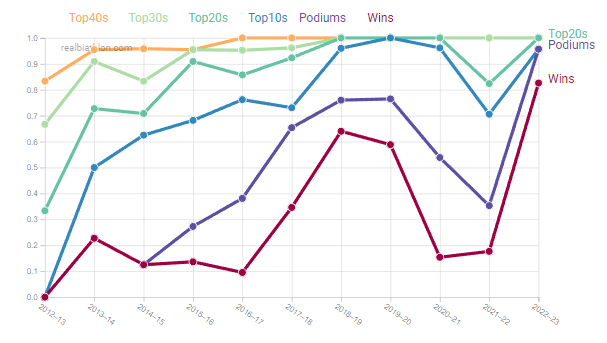
Johannes Thingnes Boe currently boasts an impressive 71 career wins at the World Cup level and a total of 109 podium appearances. These figures provide Boe with some very competitive win and podium percentages at 32.7% and 50.2%, respectively. These percentages are both above what Bjoerndalen has produced throughout his career, but also leading this discussion in terms of win percentage. Still, Fourcade holds an edge in terms of podium percentage. However, these statistics look good given that Johannes seems to be in his prime. When looking at World Cup titles, the Norwegian superstar officially won his 4 Big Globe after his dominant display on home ground in Oslo last weekend. And even though these numbers are lower than what both other GOATs have produced, Johannes has finished on the podium of the World Cup standings in an astounding 8 out of 13 seasons. Furthermore, in terms of discipline titles, he has what for this discussion could be seen as a “measly” number of 9 small globes.
| Name | Races | Rank (Avg) | Wins | Win% | 2nd | 3rd | Podiums | Podium% |
| Ole Einar Bjoerndalen | 472 | 11.9 | 94 | 19.9 | 53 | 31 | 178 | 37.7 |
| Martin Fourcade | 275 | 8.2 | 79 | 28.7 | 40 | 26 | 145 | 52.7 |
| Johannes Thingnes Boe | 217 | 7.9 | 71 | 32.7 | 21 | 17 | 109 | 50.2 |
Table 5: Comparison between Johannes Boe’s World Cup Career Race Statistics with the GOAT contenders| Name | Total Seasons | Overall Titles | 2nd | 3rd | Discipline Titles | 2nd | 3rd |
| Ole Einar Bjoerndalen | 26 | 6 | 6 | 1 | 20 | 12 | 5 |
| Martin Fourcade | 15 | 7 | 1 | 1 | 26 | 4 | 4 |
| Johannes Thingnes Boe | 13 | 4 | 2 | 2 | 9 | 8 | 4 |
Table 6: Comparison between Johannes Boe’s World Cup Career Standings Statistics In order to provide an overall, unbiased assessment, we can also analyse a 10-year sample of JT’s career. It is important to mention that if we start in the 2013-14 season, JT was 21 years old at the time and had yet to reach his prime. However, we will adjust for that later on. In this 10-year stretch, Boe’s average race rank is 7.64, with the best mark of 1.7 (meaning he is on average in the top 2 positions) this season. When we delve deeper into his results, of the 223 races in which he has competed, JT won 74 and finished on the podium in 113 races. These turn out at a percentage of 33.18% winning rate and a 50.67% podium rate. When analysing his best season to date, the just-finished 2022-23 season, his winning percentage was 82.6%, while his podium percentages reached the peaks of 95.7%. These are outstanding, never-seen-before marks that may never be replicated and it marks 2022-23 as the best biathlon season I’ve ever witnessed at the very least. Overall, the marks over a 10-year span are slightly down on the other two GOATs, but Johannes is currently having the greatest, most dominant statistical season in this conversation. As mentioned, though, he was not in his prime at the start of this 10-year span, so we can make a correction for this.
 Johannes Thingnes Boe’s average race rank (per season)
Assuming that Johannes will remain in the later stages of his peak until the 2026 Olympic Games in Cortina, we can analyse his last 7 seasons as a sample of his “peak”. This should give us a better view of how good the Norwegian was and may continue to be while at his best. In this sample, JT’s average race rank is 5.19. Furthermore, in the last 7 seasons, he has participated in 155 races, winning 63, for a 40.64% winning rate, with 99 podiums at a 63.87% rate. If we separate these 7 seasons, the dominant Boe has better statistics than either of the other two GOATs. As a result, we can clearly tell that he belongs in this conversation but is not yet the GOAT. A similar story can be told when analysing championship-level races between the three.
| Name | Wins | Podiums | No. of Races |
| Ole Einar Bjoerndalen | 79 (37.98%) | 126 (60.57%) | 208 |
| Martin Fourcade | 80 (33.19%) | 145 (60.16%) | 241 |
| Johannes Thingnes Boe | 63 (40.64%) | 99 (63.87%) | 155 |
Table 7: Comparing the Primes of the 3 GOAT contendersChampionship Level Races
A great is made in the moments when the pressure to deliver is at its highest. Much like the old adage – Diamonds are made under pressure – an athlete’s complete profile (both physiologically, both also psychologically) is seen at Championship events. We will focus on the statistics of the three when it comes to World Championships and Olympic level events.
| Name | Races | Rank (Avg) | Wins | Win% | 2nd | 3rd | Podiums | Podium% |
| Ole Einar Bjoerndalen | 19 | 10.8 | 5 | 26.3 | 3 | 1 | 9 | 47.4 |
| Martin Fourcade | 12 | 9.2 | 4 | 33.3 | 2 | 0 | 6 | 50.0 |
| Johannes Thingnes Boe | 12 | 15.3 | 3 | 25.0 | 0 | 1 | 4 | 33.3 |
Table 8: Olympic Games Results of the GOAT Candidates| Name | Races | Rank (Avg) | Wins | Win% | 2nd | 3rd | Podiums | Podium% |
| Ole Einar Bjoerndalen | 69 | 9.4 | 11 | 15.9 | 6 | 9 | 26 | 37.7 |
| Martin Fourcade | 36 | 7.1 | 11 | 30.6 | 4 | 3 | 18 | 50.0 |
| Johannes Thingnes Boe | 28 | 4.8 | 7 | 25 | 6 | 2 | 15 | 53.6 |
Table 9: World Championship Results of the GOAT Candidates| Name | Races | Rank (Avg) | Wins | Win% | 2nd | 3rd | Podiums | Podium% |
| Ole Einar Bjoerndalen | 88 | 9.7 | 16 | 18.2 | 9 | 10 | 35 | 39.8 |
| Martin Fourcade | 48 | 7.6 | 15 | 31.3 | 6 | 3 | 24 | 50.0 |
| Johannes Thingnes Boe | 40 | 7.9 | 10 | 25 | 6 | 3 | 19 | 47.5 |
Table 10: Total Championship Level Results of the GOAT Candidates Based on these statistics, we can notice that Martin Fourcade has been the most consistent top-level performer among the three. Still, we need to take Ole Einar Bjoerndalen’s statistics with a pinch of salt due to his incredible longevity that resulted in some lesser performances in his later Championship presences. On the other hand, we can see that JT Boe is coming along nicely in terms of stats, and especially at World Championship level seems to consistently fight for top 5s. However, he still misses a bit in comparison with the other two. I believe that with this, we can finally rank the top performers of all time, albeit this is the part in which controversy may start to present its head.
Current Ranking of the GOATs
While, this is an extraordinarily difficult ranking to make and I believe the best solution would be a tie, for clarity (and a bit of controversy), there should be one current GOAT. While at Championship level events Martin Fourcade holds a clear edge over the two, and especially the direct competitor (for now), Ole Einar, it is difficult to look past the sheer numbers Bjoerndalen possesses. In terms of total wins, number of Championship medals, number of podiums at World Cup level, as well number of discipline title podiums, Bjoerndalen has an edge based on his longevity. Combined with a phenomenal peak that slightly outshines Martin’s, I believe that by the narrowest of margins, the current, rightful owner of the GOAT moniker is Ole Einar Bjoerndalen. Even so, I believe that people will have different views on this and if Martin is the GOAT in your opinion, I would not put too much of a fight to argue. This does however, give us clarity as to what the template for Johannes is to take over this debate. Consequently, after all this analysis, let me present you my criteria for JT Boe becoming the GOAT of biathlon.
The Criteria to Become the Undisputed GOAT
Firstly, in regard to sheer numbers, Johannes is not yet at the level of Ole Einar, and Martin. Starting with the World Cup Titles, JT officially earned his 4th Crystal Globe. To achieve GOAT status, I believe that 6 would be sufficient and that would entail winning two of the next 3 seasons we earlier assumed as his prime. In terms of discipline titles, the Norwegian won the Sprint and Pursuit classifications this year. This notched his tally up to 9 individual, smaller Crystal Globes. I believe this is the trickiest category to give an assessment of what he would have to achieve as it is of varying importance to every fan, and journalist. Still, if he finishes his career with more than 15 titles, with another 12-16 2nd and 3rd places in those classifications, it would meet my criteria. While these are quite high standards, based on this season, JT could have won all discipline titles, had it not been for a bout with COVID that kept him out of the Oestersund round of the World Cup. As such, the extraordinary Norwegian has taught us throughout the season that nothing is impossible for him. However, there is more to it than just raw titles won.
 Fourcade vs. Boe World Cup race ranks
Secondly, when analysing winning World Cup races, I consider that if he wins more than 85 races with a winning percentage higher than 30% that would meet my criteria. Furthermore, if he overtakes Fourcade’s podium number of 145 while increasing his podium percentage over the value of 50%, that would more than merit GOAT status. Looking at the big events, starting with the World Championships, my criteria would be that he joins the GOAT group with 11 golds, at least, while increasing his winning percentage in the region of 28-30%, from his current 25% mark. In terms of podiums, I would like to see him with more than 20 medals overall, while maintaining his incredible podium rate (currently 53.6%) above 50%. Finally, in terms of the Olympic Games, JT would have to match Ole Einar’s 5 individual gold medals tally, while overtaking Martin Fourcade’s 6 podiums (he currently has 3 individual golds, with 4 podiums). Furthermore, I would like to see him increase his win and podium percentages from the current marks of 25% and 33% up to around 30% and 40-45%, respectively. If the Norwegian were to achieve these admittedly high criteria, in the next 3 seasons, assuming his peak ends with the end of this Olympic cycle, that would also give him one of the best 10-year primes, if not the best in history. Consequently, he would take the lead in the GOAT discussion in my books.
Most importantly, we can already say that Johannes is a generational talent who has had an incredible career. He is the leader of the post-Fourcade era of biathlon. Only time will tell whether he will be able to surpass the former faces of biathlon in Martin Fourcade and Ole Einar Bjoerndalen. However, I have raised the bar and presented my criteria and I will be enjoying watching whether Johannes Thingnes Boe can match it or better it.