real biathlon
    • Athletes
    • Teams
    • Races
    • Seasons
    • Scores
    • Records
    • Blog(current)
    • More
      Patreon Content Course Profiles Explanations Shortcuts
      Error Report
      Privacy Policy About
    •     
  • Forum
  • Patreon
  • Twitter
  • YouTube
    Instagram
    Facebook

Recent Articles

  • Most improved athletes this winter
  • New biathlon point system
  • Historic biathlon results create expectations. But what about points?
  • What do you expect? Practical applications of the W.E.I.S.E.
  • Introducing W. E. I. S. E: the Win Expectancy Index based on Statistical Exploration, version 1

Categories

  • Biathlon Media
  • Biathlon News
  • Long-term trends
  • Statistical analysis
  • Website updates

Archives

  • 2022
    • December
    • June
    • May
    • March
    • February
    • January
  • 2021
    • December
    • November
    • September
    • July
    • June
    • May
    • April
    • March
    • February
    • January
  • 2020
    • December
    • November
    • August
    • June
    • March
  • 2015
    • December
  • 2013
    • August
    • July
  • 2012
    • July

Search Articles

Recent Tweets

Tweets by realbiathlon

Month: April 2021

It’s all for the money. Or is it?

Posted on 2021-04-19 | by biathlonanalytics | 1 Comment on It’s all for the money. Or is it?

Introduction

Recently Real Biathlon posted data about World Cup Prize Money in biathlon on his website for Patreon members. Combined with all the other data sources he provides, if you like working with data and biathlon why not look into becoming a member as well and support him in keeping the site running? For the Prize Money data, you can easily find the major all-time earners, sort by gender and year, and use the data combined with other data sources he provides.

In the post below I have tried to look at the data from the less obvious perspectives, and see if we can get some interesting stories out of it.

Data source

The data contains all income from the IBU at the World Cup level, and excludes any income made from external sources like sponsorships, bonuses from national federations, etc. the data range starts with the 2003-2004 season and it should be kept in mind that some athletes were already active before this season so that data is not included. For team races, the data is based on the assumption that prize money is split entirely and equally among the participating athletes.

The Prize Money data source is in Euros as that’s the currency used in the IBU season guides, the source of this data for most (or all) seasons.

Equality

The first thing I wanted to explore is how the IBU deals with equality. And it’s fairly simple: prize money is based on race results, world cup scores, and bibs. And it is unrelated to the gender of the athlete; in other words, the prize money is equally handed out between man and women.
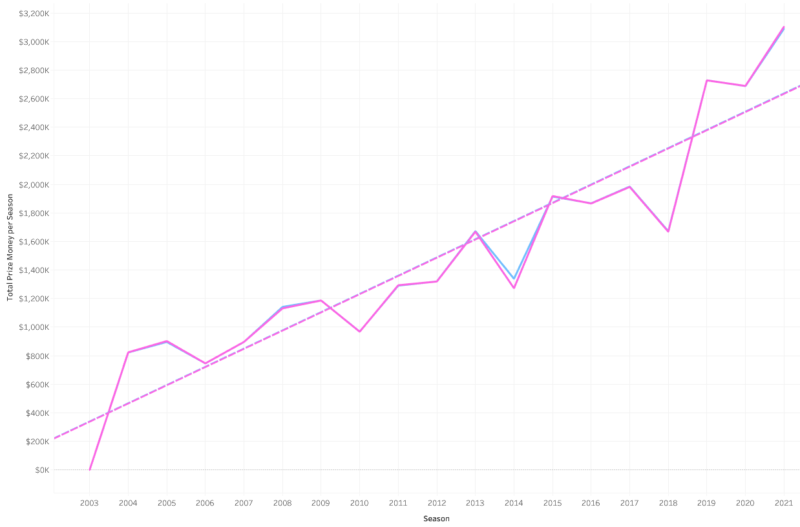
The small changes are likely happening as in some races more athletes get prize money, which then adds up for the season (say three athletes don’t finish a mass-start, the prize money is not handed out). The 2014 season seems to be the only year with a bigger difference, and quite frankly I don’t know why that is. But generally, we can see the pink line for the women pretty much overlaps the men’s blue line.

How is the money divided?

If we look at how the prize money is divided, we see that the majority of athletes do not make a lot from their sport (strictly looking at prize money). Of the 561 athletes in this dataset, only 27 (4.8%) have made over a million where 241 made €10,000 or less. And 428 athletes (76%) have made €100K or less since 2003-2004. It also appears the men are a bit more top-heavy with 26% making €100,000 or more, which is only 22% for the women.

Earning pace

I was curious to see how athletes compared when looking at how much they earned in their first, second, etc. year in the World Cup. I should remind you that if athletes were already active before the 2003-2004 season, their total earnings do not include the seasons before that.
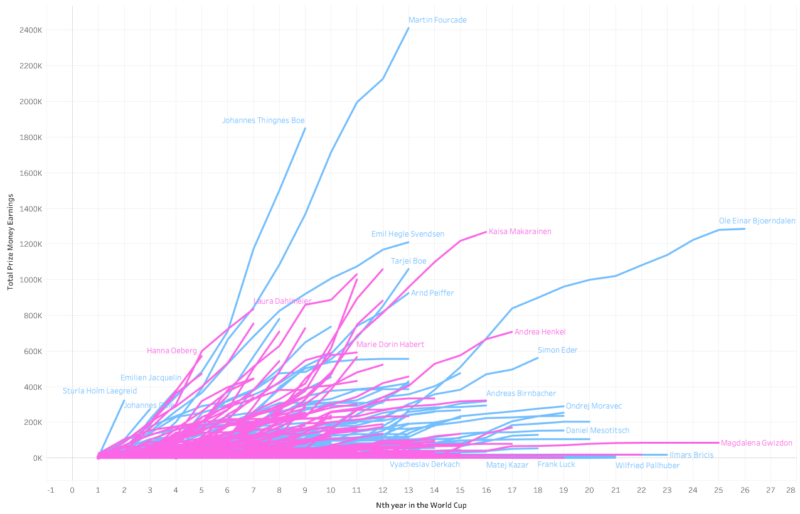
We can see a number of interesting things here, for example that Bjoerndalen didn’t make money until his 12th season (due to the above-mentioned limit in available data), Martin Fourcade made the most in total but could be caught up with by JT Boe, and Jacquelin, Dale and Laegreid are also on pace to get to Fourcades total faster or go above it. Hanna Oeberg and Denise Herrmann are on track for the women to become the biggest prize money earners, although Herrmann started later in her career with biathlon.

Another way to look at this data is average money made per race. I filtered the chart to only show those athletes that have between 30 and 150 races (to highlight the “new kids on the block”) and have a average of at least €1,500 per race:
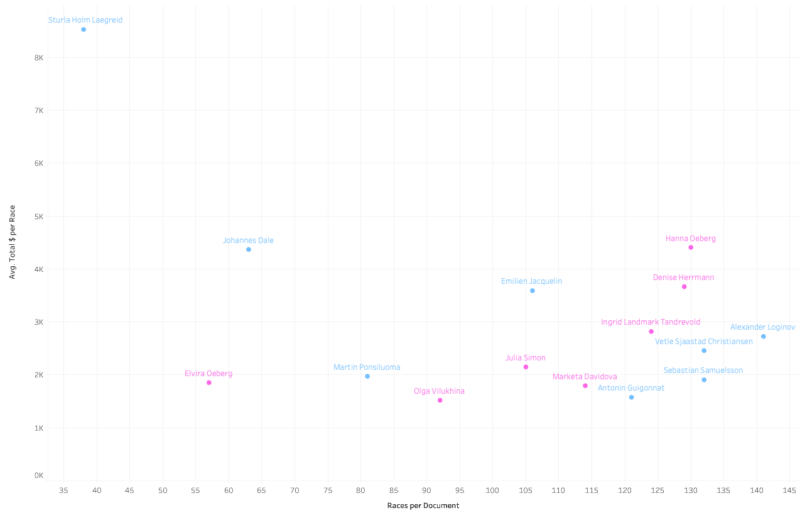
After Laegreid’s amazing first full season, it is no surprise to see him high up in the top-left corner. Dale, Jacquelin and Ponsiluoma are also in a strong position to make good money in the upcoming years if they can keep their rates going. For the women, Hanna and Elvira Oeberg, Herrmann, Tandrevold, Simon, Vilukhina and Davidova also have great ratios up to this point in their careers.

Riding the good team train

The last thing I wanted to look at are athletes that have made good money in Team races, but not so much in individual races. In other words, who has been riding the good-team train?

The chart below shows all athletes and their total prize money for team/relay races, and the percentage of earnings for team/relay races compared to their total earnings. To highlight the “train riders” (filled in circles) I selected those athletes who made more money with team/relay events than other ways (team/relay earnings > 50%) and who made more than €40,000 on team races:
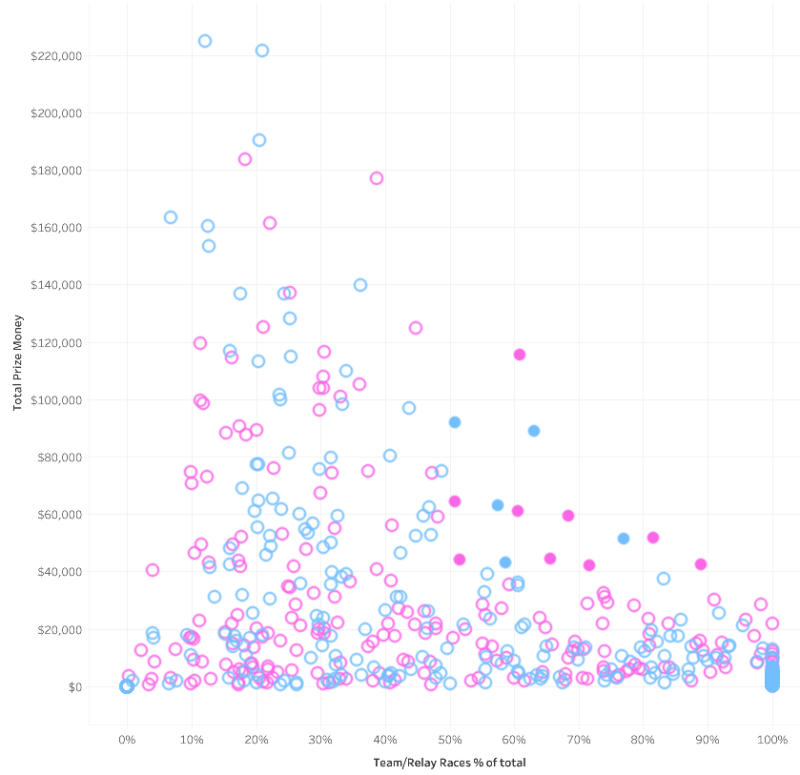
Below are the highlighted athletes with more details. We can see that an athlete like Merkushyna made 81.5% of her earnings through team/relay events for a total of €51,750. Given that she has not made much money in individual races, I think she is one of the athletes who most benefitted from being on a good team. Sophie Bailley is another great example.

This Prize Money dataset is a great addition to the site, with plenty of interesting stories to tell!

Posted in Biathlon Media, Statistical analysis | Tagged Prize Money

Latest website features

Posted on 2021-04-16 | by real biathlon | Leave a Comment on Latest website features

With the season behind us, I thought it would be a good idea to summarize the updates and new features I added to the website over the last 2-3 months. Most of them are a little hidden and not everyone will immediately see them or even be aware they are available. It’s probably useful to give a quick overview.

Histograms

I added histograms for all athlete and team pages (which previously only had line chart or box plot visualizations). I think it’s an interesting addition, particularly for shooting percentages, or to give a better overview of shooting pace and skiing speed distributions. Just like line charts, you can directly compare two athletes.

A histogram is an approximate representation of the distribution of numerical data. In a histogram, each bar groups numbers into ranges. Taller bars show that more data falls in that range. A histogram displays the shape and spread of continuous sample data.

Examples:

  • Shooting percentage distribution 2020–21: Sturla Holm Lægreid
  • Ski speed comparison: Hanna Öberg vs. Tiril Eckhoff

Ski Speed per Loop

Some athletes seem to get faster over the course of a race, while others appear to tire more quickly than the field. To quantify this a little better and find out who has particularly strong final laps, I calculated the ski speed (back from top 30 median) for each of the 3/5 ski loops. You can visualize them either as box plots or line charts (for overall career, per season, per discipline, etc).

Examples:

  • Box Plots for each Ski Loop: Dorothea Wierer
  • Box plots for Teams: Austria Mixed

Examples:

  • Line charts per Race: Comparison Dorothea Wierer vs. Hanna Öberg
  • Line chart per Season: Johannes Thingnes Bø

Head-to-head comparison

For all races, you can now compare two athletes directly. All time data (course times, shooting times, range times, etc.) is visualized through a diverging bar chart, while some other data (shooting intervals, hits/misses) are shown side by side in a table.

Examples:

  • Head-to-head comparison: Johannes Thingnes Bø vs. Sturla Holm Lægreid
  • Head-to-head team comparison: Norway vs. Germany

Video links

All race pages (since 2010–11) now have direct links to the Eurovision Sports website which hosts the official IBU videos. If available, the links usual include race replay, press conference, highlights and zeroing. For Olympic races, I linked videos from Olympic.org.

Bonus content for patrons

  • New data set of World Cup prize money: For all seasons since 2003–04, as well as cumulative all-time biathlon prize money data (since 2004).
  • Improved Comparison page: You can now compare stats not only season-to-season, but also by World Cup trimesters within a season. For example: This season’s ski speed changes January to March
  • Stats for each World Cup venue: You can look up all podium finishers, shooting results, shooting times and skiing stats for each World Cup location. I also added weather info for each race. Most data can be visualized.
Posted in Website updates | Tagged Data subscription, data visualization

Canadian biathletes finding balance

Posted on 2021-04-06 | by biathlonanalytics | Leave a Comment on Canadian biathletes finding balance

With three top 10s, sixteen top 20s and twenty-five top 30s in individual events, the 2020-2021 season was the best Canadian season in the last five years. After a dip in total World cup points in the 2019-2020 season, last season continued on the five-year trend of continuous increase in total world cup points:

So what did Canada do well to get here, and where is there still room for improvement? That is what the following review of the Canadian individual performances in the 2020-2021 season will analyse! In this analysis, I will only show some examples of Canadian performances, but a supportive dashboard with all used data for this analysis can be found on my Tableau Public page. It shows all stats for the Canadian team, both men and women, and has a second tab where a Canadian athlete can be selected to show his or her specific stats.

Skiing time

The skiing is still the area where the Canadian team overall can gain the most time. In the specific example below I compare the average ski times of the Canadian athletes to the field average, the average of the top 30 athletes, and the average of the top 10 athletes:

Although we can see Canada is closing up the gap a little compared to last season, we are still behind the overall average, and far behind the top 10 athletes. But the positive news is that we made great progress in the 2020-2021 season, indicated by the steep drop towards the averages.

Shooting time

This is where Canada has the least to gain (and the most to loose) as we continue to be very strong in fast shooting, leading many of the true biathlon nations:

Shooting accuracy

In previous seasons the fast shooting times by the Canadians often lead to less desired shooting percentages, but it appears the team and coaches are starting to find a balance between shooting fast and shooting accurate, demonstrated by both increased accuracy in Prone and Standing:

Shooting speed -vs- Accuracy

This balance between shooting fast and clean is of course the golden grail of shooting in biathlon (I wrote about this in more depth on this website in December last year). The chart below shows how this balance has changed for the different team, starting in 2016-2017 (thin line) and how teams have moved from shooting more or less accurate, and faster or slower. We see that in 2018-2019 team Canada put a lot of focus on shooting faster, which worked, but at the expense of less accuracy. Now we see that we have lost some speed (but are still very fast) but have gained accuracy. Hopefully, this trend can continue upwards towards more accuracy while remaining fast.

Individuals

The second part of the evaluation is looking at the individual athletes. All Canadian athletes can be viewed on the interactive dashboard, but here I’m letting Emma Lunder be the example here. We can see that here Accuracy -vs- Speed trend is similar to the Team’s and that she is gaining accuracy while giving up a little speed. But we can also see that here range, shooting and prep time (prep = range – shooting) is still very good and well below the field’s average:

Her total percentage of shooting accuracy (T) has increased mostly based on a strong increase in her prone shooting (P) and she well above the field’s average Total shooting percentage (T avg.). Lastly her skiing speed seems to have stabilized and is on par with the field’s average. But she is also closing the gap with the Top 30 and Top 10 averages.

Conclusion

As mentioned team Canada had a great season, as did Emma Lunder. The above will hopefully give a good explanation of how to read the interactive dashboard to see both men’s and women’s team performances for individual races, and the individual dashboards for any of the Canadian athletes. If the current trends continue and with some of the younger athletes coming through the pipeline, hopefully, we can some Canadian podiums in the next season! Go Canada!

Posted in Biathlon Media, Long-term trends, Statistical analysis

Recent Articles

  • Most improved athletes this winter
  • New biathlon point system
  • Historic biathlon results create expectations. But what about points?
  • What do you expect? Practical applications of the W.E.I.S.E.
  • Introducing W. E. I. S. E: the Win Expectancy Index based on Statistical Exploration, version 1

Categories

  • Biathlon Media
  • Biathlon News
  • Long-term trends
  • Statistical analysis
  • Website updates

Archives by Month

  • 2022: J F M A M J J A S O N D
  • 2021: J F M A M J J A S O N D
  • 2020: J F M A M J J A S O N D
  • 2015: J F M A M J J A S O N D
  • 2013: J F M A M J J A S O N D
  • 2012: J F M A M J J A S O N D

Search Articles