real biathlon
    • Athletes
    • Teams
    • Races
    • Seasons
    • Scores
    • Records
    • Blog(current)
    • More
      Patreon Content Course Profiles Explanations Shortcuts
      Error Report
      About
  • Forum
  • Patreon
  • Twitter
  • Facebook

Recent Articles

  • Pokljuka Mass Start Men in Comic form
  • When to start (in an interval start race)?
  • Biathlon Podcast: World Champs Part 1
  • All-time records for World Cup level pursuits
  • Favorites for the 2021 Biathlon World Championships

Categories

  • Biathlon Media
  • Biathlon News
  • Long-term trends
  • Statistical analysis
  • Website updates

Archives

  • 2021
    • February
    • January
  • 2020
    • December
    • November
    • August
    • June
    • March
  • 2015
    • December
  • 2013
    • August
    • July
  • 2012
    • July

Search Articles

Recent Tweets

Tweets by realbiathlon

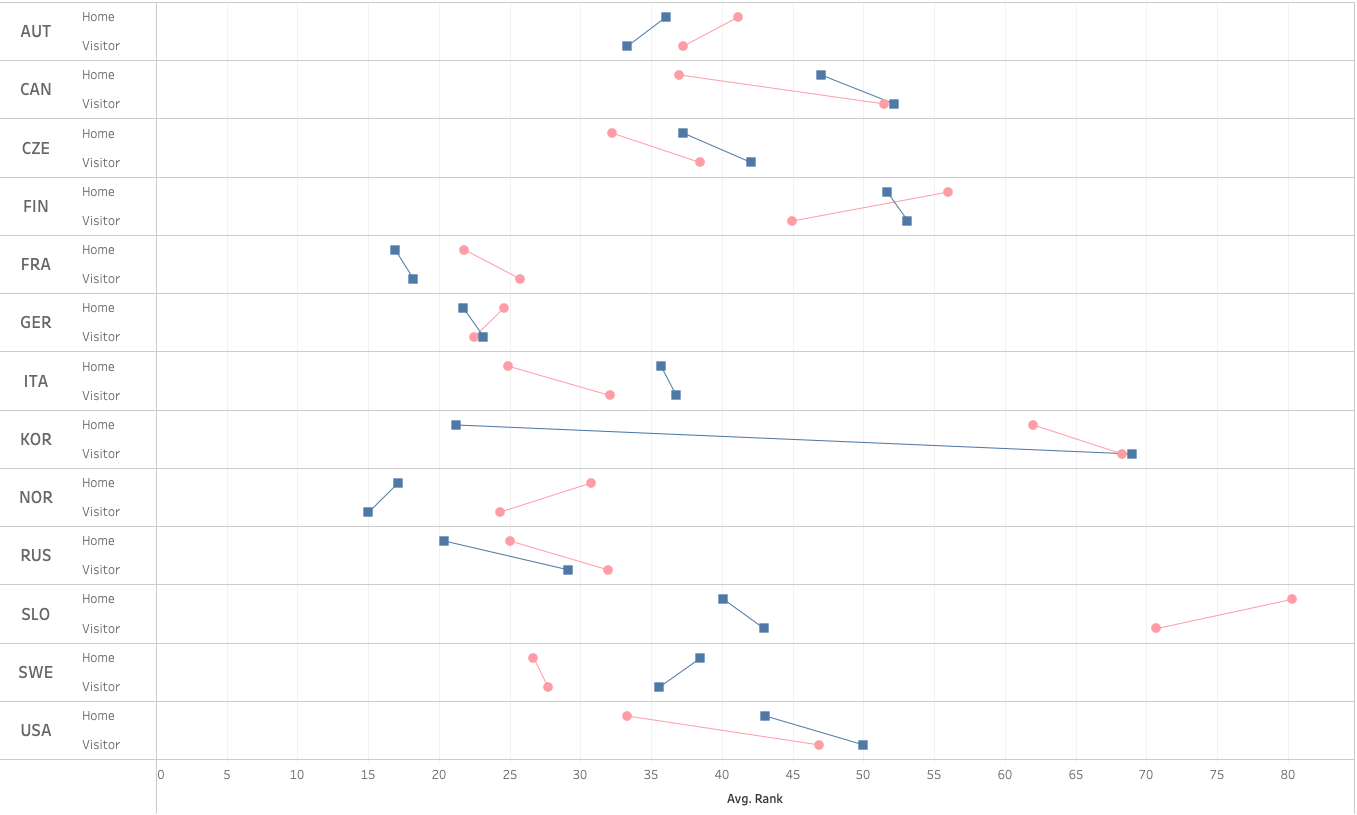
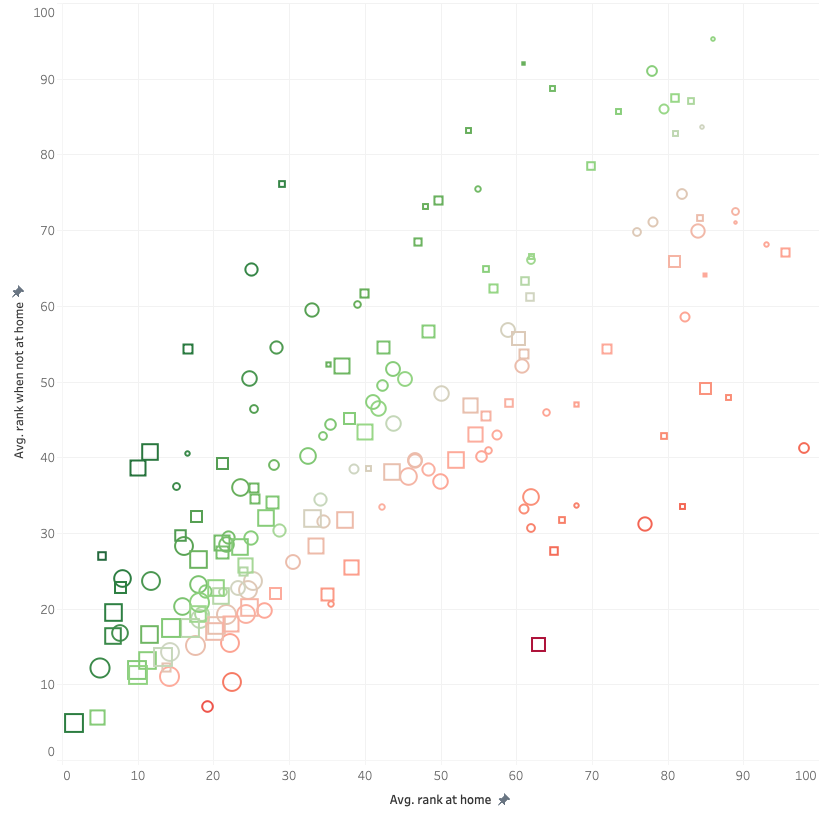
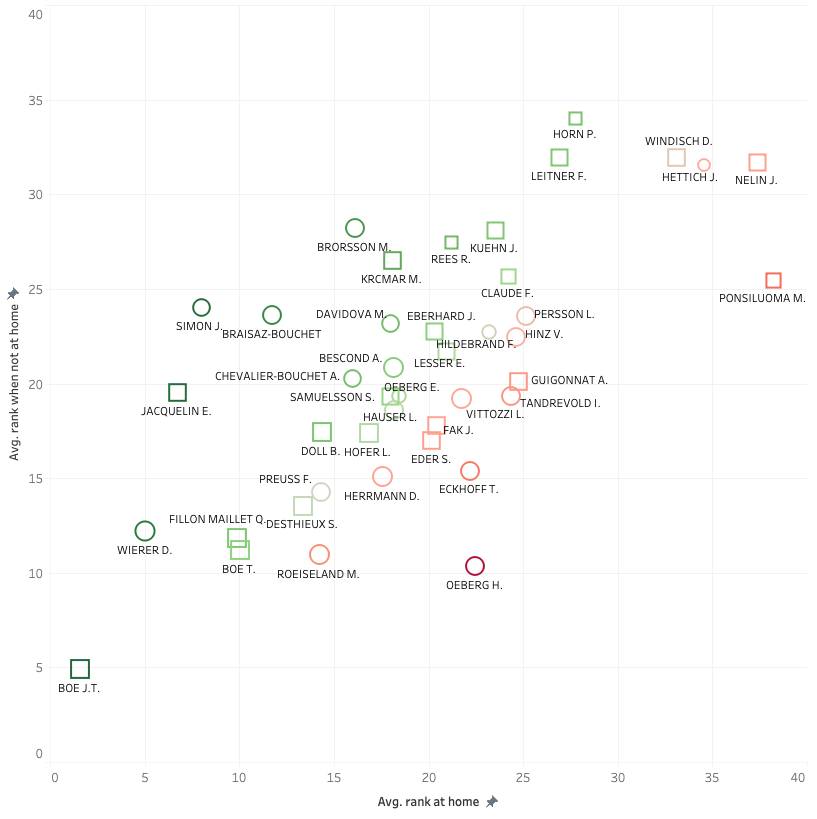
Page 3 from the Athletes Research Tool dashboard

Using Real Biathlon data to create a dashboard in Tableau

Posted on 2020-12-16 | by rjweise | 1 Comment on Using Real Biathlon data to create a dashboard in Tableau

Football and baseball are huge sports in the fantasy sports world. Biathlon is not, however that doesn’t mean it is not there at all. For example, the sports department of the German television corporation ARD has what they call the Biathlon Tipp Spiel, freely translated as the biathlon guessing game. It allows participants to predict the top 5 of any upcoming race in the IBU World Cup circuit, and although thankfully biathlon is unpredictable enough to make this pretty hard, I wanted to have a quick look into previous results to see “who’s hot and who’s not”. The following blog-post describes the steps I took to create the Puck Possessed Biathlon Athletes Research Tool on Tableau Public. For those of you who eagerly clicked on the link, please be patient as the data loads 3+ season of detailed race results. Update: I created a clone that eliminates the 2017-2018 season, resulting in better performance of the dashboards.

The data

Since the Real Biathlon data is now available through Patreon, I downloaded some of the more current race results using R. Now, there are many other coding languages and ways to do it, but since I’m most familiar with R, that is what I used. The following paragraph is a description of how the get the data using R (assuming you have a subscription). If you’re not interested in the technical stuff, skip right ahead to the Data Visualization section below.

First we need to connect to the Mongo Data base with the username and password that comes with the Patreon subscription:

install.packages("mongolite", "tidyverse", "dplyr", "jsonlite")
library(mongolite)
library(dplyr)
library(tidyverse)
library(jsonlite)

# Set username and pasword
mongousr <- "--your username--"
mongopw <- "--your password--"

# Set the collection, database and prefix to create the url
rbcol <- "RacesList"
rbdb <- "Results"
rbpref <- "biathloncluster-ay3ak"
rburl <- paste("mongodb+srv://",mongousr,":",mongopw,"@",rbpref,".mongodb.net/<dbname>?retryWrites=true&w=majority", sep="")

# Use the URL created above to connect to the correct MongoDB data
rbmongo <- mongo(collection = rbcol, db = rbdb, url = rburl, verbose = TRUE)

Now we can connect to the database. To gather all the data I wanted for my dashboard, I first got data that had all raceIds I wanted to download. Then I created a loop to go through these raceIds one by one and download the file. Below is just the code to get one single file into Tableau. Perhaps I’ll show the loop code in another blog post sometime.

# Get data from the Mongo connection created above by searching for one specific raceId
RaceBT2021SWRLCP01SWSP <- rbmongo$find('{"raceId" : "BT2021SWRLCP01SWSP"}')

# Convert the file to json
RaceBT2021SWRLCP01SWSPjson <- toJSON(RaceIdString)

# Write the json file to your computer
write(RaceBT2021SWRLCP01SWSPjson, "RaceBT2021SWRLCP01SWSPjson.json")

And that is all it takes to connect, load a file and save it as a json file. One could also save as a flat csv file here, but to do that you will have to manipulate the loaded file first as it comes with nested data, multiple levels deep. Since Tableau Public reads json files natively, I decided that using the power of Tableau Public is far more time-efficient.

Data visualization

Although the above code generates one json file for one race, for my specific dashboard I got a file for every race since the 2017-2018 season, creating over 200 files. With those sitting on my hard drive, eagerly awaiting to be visualized, do the following:

Open Tableau Public and connect to a Json file

Select one json file specifically

Drag all other json files (I assume all files are in the same folder as the first file) right below the one file from the screenshot above

Select the Schema Levels to only get the data I want to use (resist the temptation to select all when you see all the goodness that is available in these files, and stick to the KISS principle)

Now you can create a new Sheet and start on your visualization. I must admit working with the nested json files takes a little time to get used to if you are used to dealing with flat files, but in the end it works quite well!


Since I wanted to have information on athletes specifically to help me pick future winners, I wanted to make three levels of information, or dashboards: one for one race, specifically the most recent one or the most recent of the same type and on the same location as the one I’m predicting for, one to show me current form by looking at the results for the current season to date, and one for similar events in the past (so all sprint races in the last couple of seasons, or all races in Hochfilzen, etc.)

Tab 1 Race Details shows infomartion for one race, while highlighting one athlete of choice

Tab 2 Current Season Information shows information about the selected athlete that gives the reader an idea if the athlete is hot or not, or on an upward or downward trend.

Tab 3 Similar Events Results shows how athletes have performed in previous similar races as the one you are predicting for.

So please go have a look at the dashboards (full and small) and let me know what you think. And good luck making your own dashboards based on the real biathlon Patreon data subscription!

Posted in Statistical analysis | Tagged Data subscription, data visualization, Patreon, R, Tableau

New features: box plots and course profiles

Posted on 2020-12-10 | by real biathlon | Leave a Comment on New features: box plots and course profiles

I made a few updates to the site, adding box plots to athlete and team stats pages, course profiles for all World Cup 3.3 km loops and an explanation page for the most used stats (courses and explanations can be found in the navigation bar ▷ More).

The box plot allows quick graphical examination of one or more data sets and is useful for comparing distributions between several groups or sets of data. Mathematically speaking, it offers a more robust measure than a single value, which is otherwise used on this site. A box plot is a standardized way of displaying a data set based on a five-number summary: minimum, lower quartile (Q1), median, upper quartile (Q3) and maximum. The box is drawn from Q1 to Q3 with a horizontal line drawn in the middle to denote the median.

The distance between the upper and lower quartiles is known as the Interquartile range (IQR). From above the upper quartile, a distance of 1.5 times the IQR is measured out and a whisker is drawn up to the largest observed point from the dataset that falls within this distance. Similarly, a distance of 1.5 times the IQR is measured out below the lower quartile and a whisker is drawn up to the lower observed point from the dataset that falls within this distance. All other observed points are plotted as outliers.

The data for each athlete’s box plots can be filtered by season, discipline or even more precisely with a time range slider if you select “Specified Range“. Every single stat category (all except the first five in the dropdown list) also allow a per Season series visualization (the one you can see above).

Forum member PolitiskTeoriFan made these nice looking course profiles and agreed to have them posted here. Thanks a lot for that! I created a new page where you can click through all of them. Unfortunately, visualizations exist only for the 3.3km loops right now. However, they should still be useful, even for other races. At most venues this 3.3km loop is usually just an extension of shorter loops and you can use the split time positions for orientation; they rarely change between races.

Lastly, I added a page with general explanations for all major statistics. This was previously only available (hidden) under the info icon on the seasons stats page.

Posted in Website updates

Support real biathlon on Patreon

Posted on 2020-12-04 | by real biathlon | 2 Comments on Support real biathlon on Patreon

You can now support real biathlon on PATREON. For your troubles, you get bonus statistics, direct database access and the knowledge that your support helps keep the website running and all statistics up to date.

Frankly, I feel a bit strange asking for contributions, but after some pretty high traffic for this site during the initial World Cup weekend, I fear that after putting a lot of time into this project in the summer, I now might have to pay for it in the winter – specifically covering costs for exceeding free-tier database limits. The ads on this site don’t generate a lot of money, so after thinking about it for a while, I decided to give this Patreon idea a try.

Since I didn’t just want to ask for donations with nothing in return, I came up with a few Patreon rewards I believe should be interesting for biathlon enthusiasts. I added a new page realbiathlon.com/patreon – you can get the password as a patron. Also, there’s the option to get direct database access; if that’s something you are interested in.

These are the bonus statistics I set up initially (there will probably be more later):

  • Stats per Nation: All-time results and data for each country in individual events
  • Season-to-Season Changes: Comparisons across seasons for most athlete statistics
  • Race Projections: Predictions for each discipline and event based on season stats
  • Long-term trends: Performance trends in ski speed, shooting accuracy and shooting pace

I hope most of these additional stats are quite useful and interesting. I compiled another data set for each national team, but this time with results not for relays, but for all non-team events per nation, including (averaged) shooting and skiing data.

France Men | Top 3 per race (10 race moving average)

Here are two examples of available bonus statistics: The first chart shows the French results declining a lot after Raphaël Poirée‘s retirement, but currently they are doing a lot better compensating for Martin Fourcade‘s absence. Germany’s women on the other hand had their peak in the mid-2000s (with over 20% of their athletes on the podium), and a steep decline after Magdalena Neuner‘s retirement.

Germany Women | Results per race

I have already used some of the other stats I created in recent posts, namely Ski Speed comparison season-to-season or Projection for the season opener; that should give you an idea what to expect (available for many other categories and seasons). Examples for long term biathlon trends can be seen here.

Should you be interested in digging into the data for yourself, I set up a way to allow direct access to the real biathlon databases in several programming languages (Java, Python, C#, C++, C, R) – please keep in mind you will need at least some programming skill to utilize them. All are MongoDB (NoSQL) databases hosted on MongoDB Atlas (data is in JSON format).

One thing I was especially unsure about was finding appropriate tier levels. I set up the higher tiers more as a joke – please only consider them if you are looking for a quick way to get rid of your money. 😉

real biathlon on PATREON

Posted in Website updates

Ski Speed comparison season-to-season

Posted on 2020-12-02 | by real biathlon | 5 Comments on Ski Speed comparison season-to-season

It’s probably no use to look at shooting percentages after only 30 shots at the beginning of a season, however, the ski speed at the first World Cup weekend might already tell us at least a little bit where the season is going and how the ski form for some of the top athletes might have changed over the summer.

If you can’t find a specific athlete, you can always look up complete World Cup statistics for the ongoing season here:

  • Ski speed: Men | Women
  • Shooting percentage: Men | Women
  • Shooting Times: Men | Women

Note: Only athletes with at least 15 races last season and 2 races this season are included in the two tables below. “Back from Top30 median” is the percentage back from each race’s top 30 median Course Time (arithmetic mean per season).


Men

Sergey Bocharnikov was the most improved overall; he skied 4.7% faster and lowered his average ski rank by 38.7. Maybe even more impressive though, Sebastian Samuelsson and Martin Ponsiluoma both improved by 3.7%, and did so on a much higher level. Surprise winner Sturla Holm Lægreid does not show up here, because he only appeared in 4 races last season, however, he did improve his speed by 1.7%

Johannes Thingnes Bø continued where he left off: he was not simply the fastest overall (over 1% ahead of the 2nd fastest, his brother Tarjei Bø), he also set the top Course Time in both races. One of the pre-season favorites, Quentin Fillon Maillet, shot great (96.7%), but did not have the best weekend skiing-wise (his average ski rank increased from 5.6 to 15.0). Dmytro Pidruchnyi struggled the most, he was 3.3% slower than last season.

Changes in Ski Speed compared to 2019–20 season

NoFamily NameGiven NameNationRacesSki Rank
(avg)
Changeback from
Top30 median
(in %)
Change
NoFamily NameGiven NameNationRacesSki Rank
(avg)
Changeback from
Top30 median
(in %)
Change
1BocharnikovSergeyBLR
210.5-38.7-0.99-4.67
2SamuelssonSebastianSWE
23.5-25.2-2.23-3.69
3PonsiluomaMartinSWE
24.5-22.6-2.16-3.67
4NelinJesperSWE
28.5-16.1-0.95-1.89
5FakJakovSLO
217.5-12.5+0.10-1.58
6MoravecOndrejCZE
231.5-8.2+1.45-1.37
7ChristiansenVetle SjaastadNOR
29.5-7.6-1.26-1.26
8BoeTarjeiNOR
23.0-5.0-2.48-1.15
9BauerKlemenSLO
236.0-10.2+2.17-1.10
10JacquelinEmilienFRA
26.5-5.2-1.41-0.92
11BoeJohannes ThingnesNOR
21.0-2.0-3.61-0.71
12ClaudeFlorentBEL
237.0-3.2+2.37-0.58
13ClaudeFabienFRA
212.5-2.5-0.44-0.48
14RastorgujevsAndrejsLAT
218.0+0.4+0.16-0.31
15LoginovAlexanderRUS
213.5-4.0-0.21-0.28
16HoferLukasITA
217.5+1.8-0.09-0.20
17DaleJohannesNOR
210.0+0.2-1.28-0.09
18PeifferArndGER
216.5+0.9-0.13-0.08
19IlievVladimirBUL
224.0+2.0+0.72+0.02
20KrcmarMichalCZE
232.0+4.8+1.51+0.02
21SeppalaTeroFIN
232.5+4.7+1.62+0.29
22EliseevMatveyRUS
235.5+7.9+2.39+0.31
23WegerBenjaminSUI
234.0+5.3+2.00+0.43
24LeitnerFelixAUT
230.0+6.5+1.36+0.47
25GuigonnatAntoninFRA
232.5+10.5+1.66+0.52
26BjoentegaardErlendNOR
216.5+6.4+0.08+0.97
27DesthieuxSimonFRA
221.0+8.7+0.40+1.04
28EderSimonAUT
245.0+9.5+3.60+1.35
29PrymaArtemUKR
243.0+14.6+3.13+1.48
30Fillon MailletQuentinFRA
215.0+9.4-0.30+1.76
31DollBenediktGER
225.0+15.1+0.92+1.92
32EberhardJulianAUT
229.5+18.4+1.38+2.09
33KuehnJohannesGER
223.5+16.8+0.79+2.14
34FemlingPeppeSWE
265.5+17.9+5.54+2.31
35PidruchnyiDmytroUKR
257.0+33.1+4.59+3.33

Women

Among regular starters, Elvira Öberg was by far the most improved, 3.7% faster than last season. Her sister Hanna Öberg also improved a lot; the Kontiolahti sprint was her first ever race setting the top ski time. Lisa Theresa Hauser and Franziska Preuß also got considerably faster, but their improvement might not have been as obvious, because both hit only 25 out of 30 targets (83.3%), some 3-5% below their shooting percentage from last winter.

Lena Häcki, Julia Simon and Monika Hojnisz-Staręga all struggled to get going, skiing at least 3% slower. Hojnisz-Staręga had a particularly bad season opening, her average ski rank was 46.5 higher than last season, 5.0% behind her ski speed from last winter. Alongside the Öberg sisters, Tiril Eckhoff was fastest overall (but only managed a 66.7% hit rate). Last year’s top skier, Denise Herrmann, was not at her peak speed yet (+1.2%), however, her career-high 86.7% hit rate looks promising.

Changes in Ski Speed compared to 2019–20 season

NoFamily NameGiven NameNationRacesSki Rank
(avg)
Changeback from
Top30 median
(in %)
Change
NoFamily NameGiven NameNationRacesSki Rank
(avg)
Changeback from
Top30 median
(in %)
Change
1OebergElviraSWE
23.5-22.0-2.07-3.68
2HauserLisa TheresaAUT
216.0-18.7+0.16-1.93
3OebergHannaSWE
23.5-10.6-2.02-1.63
4PreussFranziskaGER
212.0-10.2-0.26-0.92
5TalihaermJohannaEST
250.0-4.3+3.85-0.64
6TandrevoldIngrid LandmarkNOR
26.0-6.7-1.18-0.63
7BrorssonMonaSWE
222.5-5.3+0.65-0.62
8GasparinAitaSUI
247.0+3.8+3.34-0.11
9KryukoIrynaBLR
227.5-1.0+1.58-0.09
10LunderEmmaCAN
240.5+2.0+2.70-0.09
11CharvatovaLucieCZE
226.0+1.1+1.43-0.05
12DavidovaMarketaCZE
210.5-0.3-0.55+0.28
13Braisaz-BouchetJustineFRA
26.5+0.7-1.71+0.30
14BescondAnaisFRA
217.5+0.1+0.40+0.33
15EckhoffTirilNOR
24.0-1.5-2.15+0.35
16GasparinElisaSUI
261.5+11.3+4.42+0.64
17PerssonLinnSWE
226.5+3.9+1.50+0.69
18EderMariFIN
216.5+3.0+0.07+0.71
19RiederChristinaAUT
272.5+14.2+6.25+0.92
20SanfilippoFedericaITA
247.0+8.4+3.54+1.07
21InnerhoferKatharinaAUT
225.0+6.6+1.37+1.12
22PuskarcikovaEvaCZE
255.5+18.4+4.10+1.12
23HerrmannDeniseGER
26.5+3.9-1.85+1.18
24ZbylutKingaPOL
271.0+18.1+5.81+1.63
25OjaReginaEST
279.5+20.2+7.41+1.90
26ZukKamilaPOL
238.0+17.5+2.42+2.05
27WiererDorotheaITA
225.0+15.0+1.33+2.32
28HinzVanessaGER
250.5+27.4+3.62+2.58
29VittozziLisaITA
243.5+23.5+3.27+2.74
30KuklinaLarisaRUS
258.0+22.7+5.03+2.77
31SemerenkoVitaUKR
273.5+28.5+6.25+2.89
32HaeckiLenaSUI
245.5+28.6+3.35+3.17
33SimonJuliaFRA
247.5+33.0+3.28+3.38
34Hojnisz-StaregaMonikaPOL
263.5+46.5+4.87+5.01

Posted in Statistical analysis | Tagged 2020–21 season, ski speed, skiing

Shooting Speed

Posted on 2020-12-02 | by rjweise | Leave a Comment on Shooting Speed

An analysis of shooting speed in biathlon, using the women’s individual race in Kontiolahti as an example. The data came from the real biathlon website, here is the exact link.

To get this data in a workable format, I just copied the table, pasted it in a text editor and copied/pasted that to Google Sheets. From there I had to do some splitting and moving things around but it was still fairly easy to get a working table. The only time consuming part was manually assigning hits or misses, and for that reason I only did to for the top 30 athletes. Then I added som ecalcualtion for athlete averages, max and min shooting times, etc. Although that can be done in Tableau, I find once you start working with filters etc. in becomes unnessessarily compicated in Tableau, just much easier to calculate the fields in Google Sheets.

Just a reminder the Tableau Dashboard below is interactive and intended to be used for further exploration of data. If you open it on the Tableau Public site you can use it full screen. Enjoy!

Posted in Statistical analysis | Tagged data visualization, Puck Possessed, shooting

Posts navigation

Older posts
Newer posts

Recent Articles

  • Pokljuka Mass Start Men in Comic form
  • When to start (in an interval start race)?
  • Biathlon Podcast: World Champs Part 1
  • All-time records for World Cup level pursuits
  • Favorites for the 2021 Biathlon World Championships

Categories

  • Biathlon Media
  • Biathlon News
  • Long-term trends
  • Statistical analysis
  • Website updates

Archives by Month

  • 2021: J F M A M J J A S O N D
  • 2020: J F M A M J J A S O N D
  • 2015: J F M A M J J A S O N D
  • 2013: J F M A M J J A S O N D
  • 2012: J F M A M J J A S O N D

Search Articles