real biathlon
    • Athletes
    • Teams
    • Races
    • Seasons
    • Scores
    • Records
    • Blog(current)
    • More
      Patreon Content Videos Explanations Shortcuts
      Error Report
      Privacy Policy About
    •     
  • Forum
  • Patreon
  • X
  • YouTube
    Instagram
    Facebook

Recent Articles

  • Junior + U23 Development Index – Men
  • Junior + U23 Development Index – Women
  • The Path to GOAT Status
  • Most improved athletes this winter
  • New biathlon point system

Categories

  • Biathlon Media
  • Biathlon News
  • Long-term trends
  • Statistical analysis
  • Website updates

Archives

  • 2024
    • March
  • 2023
    • March
  • 2022
    • December
    • June
    • May
    • March
    • February
    • January
  • 2021
    • December
    • November
    • September
    • July
    • June
    • May
    • April
    • March
    • February
    • January
  • 2020
    • December
    • November
    • August
    • June
    • March
  • 2015
    • December
  • 2013
    • August
    • July
  • 2012
    • July

Search Articles

Recent Tweets

Tweets by realbiathlon

Category: Statistical analysis

A follow-up on going the distance.

Posted on 2021-05-06 | by biathlonanalytics | Leave a Comment on A follow-up on going the distance.

On March 14 I wrote an article called “Is the IBU going the distance” in which I found that biathlon races typically don’t go the exact distance set for race events. The following is a follow up on that article, using GPS data from athlete Baiba Bendika (follow her on Twitter or Instagram) of her two races in Nove Mesto and two races in Oberhof. I should note that the GPS data from her Strava account (she kindly exported and send them to me) comes from her watch, not sure which brand, but the accuracy will not be perfect. But then again, it’s the best I can get when it comes to tracking the course.

First I read her data in Tableau and manually divided her GPS measurements (points) into sections like lap 1, penalty lap 2, range 2, etc.

This also allowed me to see her race in a “flat line” based on distance raced and time elapsed:

We already know how many penalty laps Baiba had, so we can take out the time spent in the penalty loops. This leaves us with the following distances:

Even if we include the penalty loops and decrease the distances by 150 per loop, we get:

  • Nove Mesto on March 6: 7,307 – 600 = 6,707 (793 m under)
  • Nove Mesto on March 12: 6,948 – 150 = 6,798 (702 m under)
  • Oberhof on January 8: 8,186 – 300 = 7,886 (386 m over)
  • Oberhof on January 14: 8,281 – 450 = 7,831 (331 m over)

Now we know that her watches’ GPS is not perfect, and that some of the penalty loop section (that overlaps the course) should be included, but even then our previous conclusion that the IBU doesn’t take the distance requirements all too serious is still correct, going both under (Nove Mesto) and over (Oberhof).

The main reason why this is important is that a lot of stats like ski speed and range time are often based on the assumption that ski distances and range sections are equal from race to race and location to location. Clearly, they are not and actual distances should be accounted for when available.

(Thank you Baiba for sharing your GPS files with me!)

Posted in Statistical analysis

It’s all for the money. Or is it?

Posted on 2021-04-19 | by biathlonanalytics | 1 Comment on It’s all for the money. Or is it?

Introduction

Recently Real Biathlon posted data about World Cup Prize Money in biathlon on his website for Patreon members. Combined with all the other data sources he provides, if you like working with data and biathlon why not look into becoming a member as well and support him in keeping the site running? For the Prize Money data, you can easily find the major all-time earners, sort by gender and year, and use the data combined with other data sources he provides.

In the post below I have tried to look at the data from the less obvious perspectives, and see if we can get some interesting stories out of it.

Data source

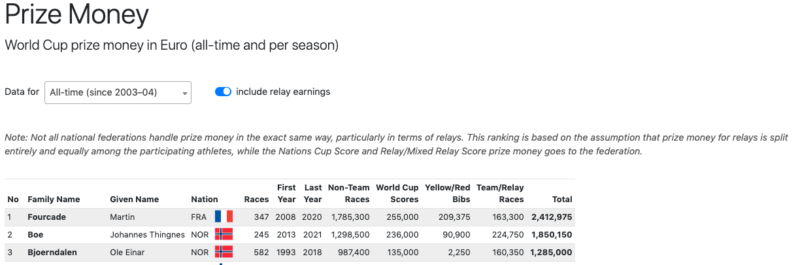
The data contains all income from the IBU at the World Cup level, and excludes any income made from external sources like sponsorships, bonuses from national federations, etc. the data range starts with the 2003-2004 season and it should be kept in mind that some athletes were already active before this season so that data is not included. For team races, the data is based on the assumption that prize money is split entirely and equally among the participating athletes.

The Prize Money data source is in Euros as that’s the currency used in the IBU season guides, the source of this data for most (or all) seasons.

Equality

The first thing I wanted to explore is how the IBU deals with equality. And it’s fairly simple: prize money is based on race results, world cup scores, and bibs. And it is unrelated to the gender of the athlete; in other words, the prize money is equally handed out between man and women.

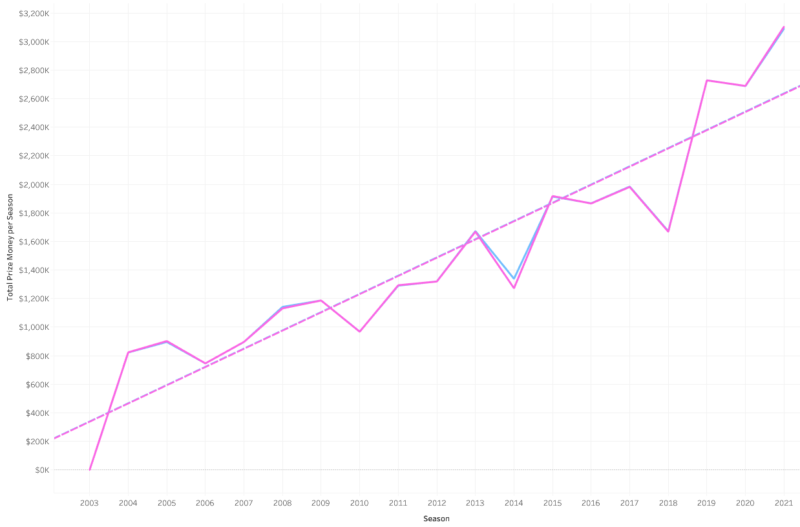
The small changes are likely happening as in some races more athletes get prize money, which then adds up for the season (say three athletes don’t finish a mass-start, the prize money is not handed out). The 2014 season seems to be the only year with a bigger difference, and quite frankly I don’t know why that is. But generally, we can see the pink line for the women pretty much overlaps the men’s blue line.

How is the money divided?

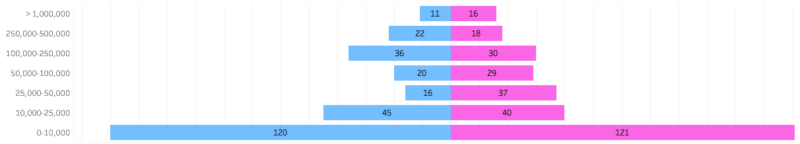
If we look at how the prize money is divided, we see that the majority of athletes do not make a lot from their sport (strictly looking at prize money). Of the 561 athletes in this dataset, only 27 (4.8%) have made over a million where 241 made โ‚ฌ10,000 or less. And 428 athletes (76%) have made โ‚ฌ100K or less since 2003-2004. It also appears the men are a bit more top-heavy with 26% making โ‚ฌ100,000 or more, which is only 22% for the women.

Earning pace

I was curious to see how athletes compared when looking at how much they earned in their first, second, etc. year in the World Cup. I should remind you that if athletes were already active before the 2003-2004 season, their total earnings do not include the seasons before that.

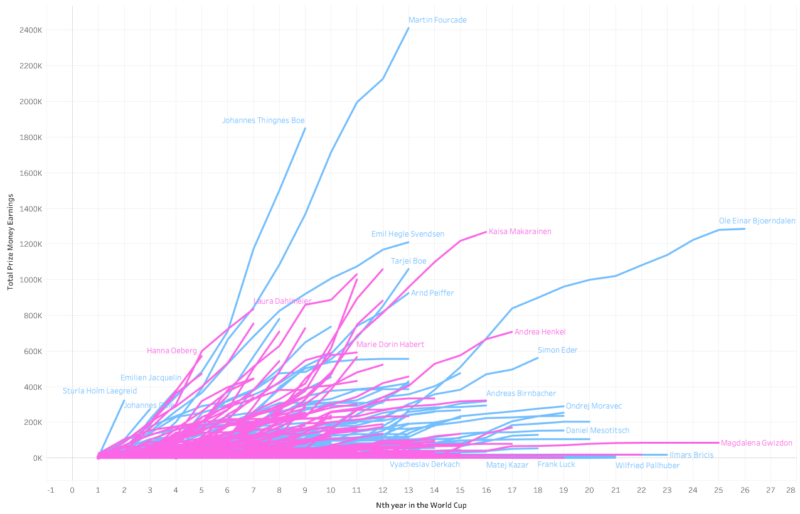
We can see a number of interesting things here, for example that Bjoerndalen didn’t make money until his 12th season (due to the above-mentioned limit in available data), Martin Fourcade made the most in total but could be caught up with by JT Boe, and Jacquelin, Dale and Laegreid are also on pace to get to Fourcades total faster or go above it. Hanna Oeberg and Denise Herrmann are on track for the women to become the biggest prize money earners, although Herrmann started later in her career with biathlon.

Another way to look at this data is average money made per race. I filtered the chart to only show those athletes that have between 30 and 150 races (to highlight the “new kids on the block”) and have a average of at least โ‚ฌ1,500 per race:

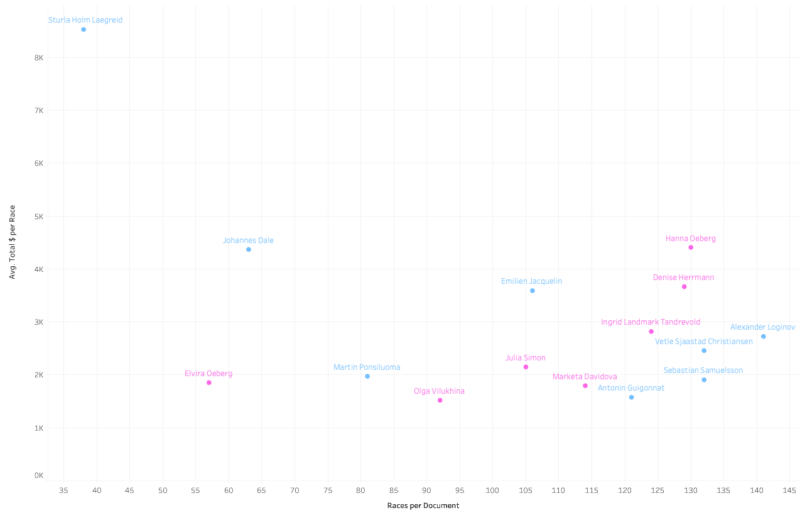
After Laegreid’s amazing first full season, it is no surprise to see him high up in the top-left corner. Dale, Jacquelin and Ponsiluoma are also in a strong position to make good money in the upcoming years if they can keep their rates going. For the women, Hanna and Elvira Oeberg, Herrmann, Tandrevold, Simon, Vilukhina and Davidova also have great ratios up to this point in their careers.

Riding the good team train

The last thing I wanted to look at are athletes that have made good money in Team races, but not so much in individual races. In other words, who has been riding the good-team train?

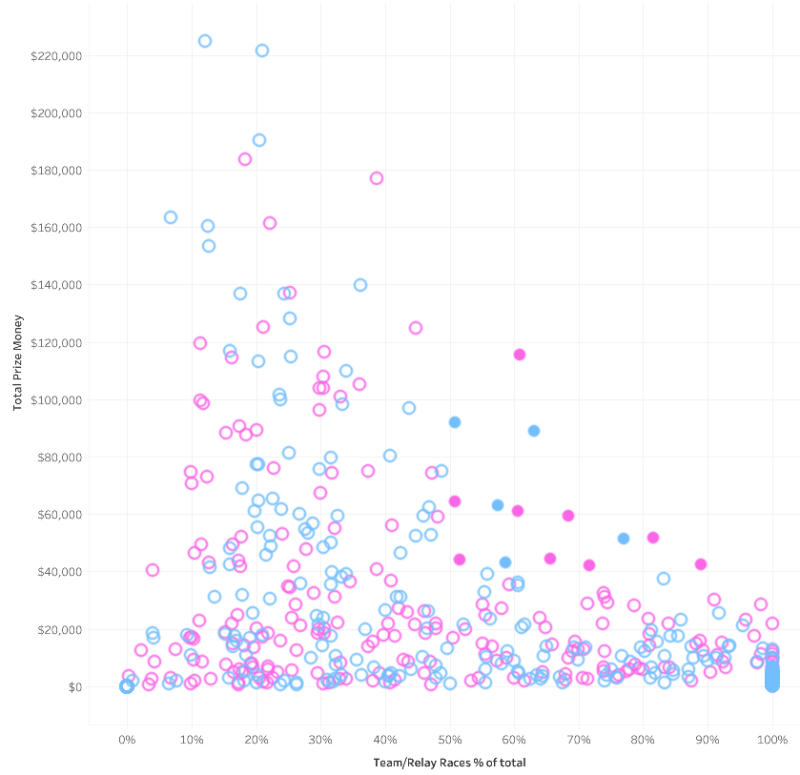
The chart below shows all athletes and their total prize money for team/relay races, and the percentage of earnings for team/relay races compared to their total earnings. To highlight the “train riders” (filled in circles) I selected those athletes who made more money with team/relay events than other ways (team/relay earnings > 50%) and who made more than โ‚ฌ40,000 on team races:

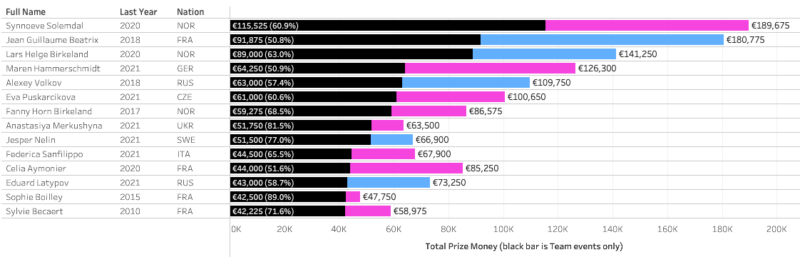
Below are the highlighted athletes with more details. We can see that an athlete like Merkushyna made 81.5% of her earnings through team/relay events for a total of โ‚ฌ51,750. Given that she has not made much money in individual races, I think she is one of the athletes who most benefitted from being on a good team. Sophie Bailley is another great example.

This Prize Money dataset is a great addition to the site, with plenty of interesting stories to tell!

Posted in Biathlon Media, Statistical analysis | Tagged Prize Money

Canadian biathletes finding balance

Posted on 2021-04-06 | by biathlonanalytics | Leave a Comment on Canadian biathletes finding balance

With three top 10s, sixteen top 20s and twenty-five top 30s in individual events, the 2020-2021 season was the best Canadian season in the last five years. After a dip in total World cup points in the 2019-2020 season, last season continued on the five-year trend of continuous increase in total world cup points:

So what did Canada do well to get here, and where is there still room for improvement? That is what the following review of the Canadian individual performances in the 2020-2021 season will analyse! In this analysis, I will only show some examples of Canadian performances, but a supportive dashboard with all used data for this analysis can be found on my Tableau Public page. It shows all stats for the Canadian team, both men and women, and has a second tab where a Canadian athlete can be selected to show his or her specific stats.

Skiing time

The skiing is still the area where the Canadian team overall can gain the most time. In the specific example below I compare the average ski times of the Canadian athletes to the field average, the average of the top 30 athletes, and the average of the top 10 athletes:

Although we can see Canada is closing up the gap a little compared to last season, we are still behind the overall average, and far behind the top 10 athletes. But the positive news is that we made great progress in the 2020-2021 season, indicated by the steep drop towards the averages.

Shooting time

This is where Canada has the least to gain (and the most to loose) as we continue to be very strong in fast shooting, leading many of the true biathlon nations:

Shooting accuracy

In previous seasons the fast shooting times by the Canadians often lead to less desired shooting percentages, but it appears the team and coaches are starting to find a balance between shooting fast and shooting accurate, demonstrated by both increased accuracy in Prone and Standing:

Shooting speed -vs- Accuracy

This balance between shooting fast and clean is of course the golden grail of shooting in biathlon (I wrote about this in more depth on this website in December last year). The chart below shows how this balance has changed for the different team, starting in 2016-2017 (thin line) and how teams have moved from shooting more or less accurate, and faster or slower. We see that in 2018-2019 team Canada put a lot of focus on shooting faster, which worked, but at the expense of less accuracy. Now we see that we have lost some speed (but are still very fast) but have gained accuracy. Hopefully, this trend can continue upwards towards more accuracy while remaining fast.

Individuals

The second part of the evaluation is looking at the individual athletes. All Canadian athletes can be viewed on the interactive dashboard, but here I’m letting Emma Lunder be the example here. We can see that here Accuracy -vs- Speed trend is similar to the Team’s and that she is gaining accuracy while giving up a little speed. But we can also see that here range, shooting and prep time (prep = range – shooting) is still very good and well below the field’s average:

Her total percentage of shooting accuracy (T) has increased mostly based on a strong increase in her prone shooting (P) and she well above the field’s average Total shooting percentage (T avg.). Lastly her skiing speed seems to have stabilized and is on par with the field’s average. But she is also closing the gap with the Top 30 and Top 10 averages.

Conclusion

As mentioned team Canada had a great season, as did Emma Lunder. The above will hopefully give a good explanation of how to read the interactive dashboard to see both men’s and women’s team performances for individual races, and the individual dashboards for any of the Canadian athletes. If the current trends continue and with some of the younger athletes coming through the pipeline, hopefully, we can some Canadian podiums in the next season! Go Canada!

Posted in Biathlon Media, Long-term trends, Statistical analysis

Shooting Efficiency: 2019โ€“20 vs. 2020โ€“21

Posted on 2021-03-30 | by real biathlon | Leave a Comment on Shooting Efficiency: 2019โ€“20 vs. 2020โ€“21

After examining changes in skiing speed, let’s also look at a comparison of overall shooting quality between the 2019โ€“20 and the 2020โ€“21 seasons for all regular Biathlon World Cup athletes. To do that, I came up with the concept of Shooting Efficiency, an attempt to combine shooting accuracy and shooting time into one metric. For more details how it’s calculated, see here.

If you can’t find a specific athlete, you can look up the complete World Cup field (also available per trimester) for latest season (as well as all previous seasons) here:

  • 2020โ€“21 Shooting Efficiency: Men | Women

Note: Only athletes with at least 4 non-team races last season and 16 non-team races this winter are included in the tables below. Shooting Efficiency is an overall shooting score, combining shooting accuracy and shooting time. It is the theoretical average time an athlete loses through shooting (based on hit rate, range time and potential penalty loops). For more details, see here.


Men

Lukas Hofer improved his non-team hit rate by 7.1% and managed his quickest shooting times (avg. 29.1s) since the 2009โ€“10 season โ€“ which makes him the most improved among regular starters in the men’s field. The overall most efficient shooter, Simon Eder, also improved significantly over last season: he set his career best hit rate (93.3%) and his average theoretical time loss of 1:48.9 is the fastest ever for this Shooting Efficiency score.

If you have been wondering why Johannes Thingnes Bรธ had to fight so hard to defend his title (despite being close to his best ever ski speed), this stat gives the answer: in a sprint he loses the time equivalent of almost an entire additional penalty loop (roughly 2 penalty loops in pursuits/mass starts) compared to last winter (-6.9% hit rate). Sturla Holm Lรฆgreid was the overall 2nd best shooter, thanks to outstanding hit rate (92.6%) and great range times (46.8s). Interestingly, Lรฆgreid’s range time is faster than Eder’s, even though Eder’s shooting time is 0.6s better; apparently Lรฆgreid’s shooting preparation is close to one second quicker.

Changes in Shooting Efficiency | 2019โ€“20 vs. 2020โ€“21

NoFamily NameGiven NameNationRacesHit RateRange TimePenalty LoopTime Loss
Sprint
Change
NoFamily NameGiven NameNationRacesHit RateRange TimePenalty LoopTime Loss
Sprint
Change
1HoferLukasITA
2684.2948.820.22:09.3-20.2
2SimaMichalSVK
1684.0950.422.92:17.1-17.9
3PonsiluomaMartinSWE
2679.5247.521.62:19.3-16.1
4SamuelssonSebastianSWE
2687.1449.521.22:06.2-14.3
5EderSimonAUT
2693.3347.022.31:48.9-12.1
6GowChristianCAN
2187.5048.422.02:04.3-12.0
7WegerBenjaminSUI
2486.8450.222.32:09.7-10.9
8LesserErikGER
2386.9448.122.02:04.8-9.9
9NordgrenLeifUSA
1785.4250.323.12:14.2-9.5
10GowScottCAN
1982.8646.823.02:12.9-9.4
11EliseevMatveyRUS
2589.0046.722.11:57.7-9.4
12LatypovEduardRUS
2582.7550.621.82:18.9-9.3
13RastorgujevsAndrejsLAT
1980.3350.521.42:23.2-5.9
14DovzanMihaSLO
2088.0046.022.91:59.5-5.6
15VarabeiMaksimBLR
2078.3354.822.42:38.3-4.9
16HarjulaTuomasFIN
1786.9650.422.22:09.7-3.9
17KrcmarMichalCZE
2086.5650.321.72:09.7-3.9
18FemlingPeppeSWE
2182.8147.822.82:14.9-3.5
19LeitnerFelixAUT
2385.0053.122.22:19.5-2.6
20LangerThierryBEL
1881.1553.922.82:30.6-2.0
21FakJakovSLO
2690.7147.921.71:55.9-1.8
22SeppalaTeroFIN
2179.6951.121.62:26.2-1.0
23IlievVladimirBUL
1775.6051.022.02:35.5-0.8
24WindischDominikITA
1976.5550.121.12:29.6-0.6
25ClaudeFabienFRA
2579.0048.421.32:21.5-0.0
26BocharnikovSergeyBLR
2282.9450.824.32:23.0+0.1
27KomatzDavidAUT
2290.5953.921.72:08.2+0.7
28ClaudeFlorentBEL
1985.3654.022.22:20.5+0.8
29DohertySeanUSA
1982.1449.322.22:18.3+1.1
30DollBenediktGER
2681.4348.321.92:17.1+1.4
31Fillon MailletQuentinFRA
2587.2546.622.92:02.5+1.7
32JacquelinEmilienFRA
2687.3846.921.12:00.4+2.2
33BoeTarjeiNOR
2685.7149.920.32:08.8+2.3
34StroliaVytautasLTU
1678.1853.122.72:35.6+2.8
35PeifferArndGER
2187.9448.721.42:03.1+3.1
36BormoliniThomasITA
1884.0749.722.12:14.5+3.2
37PrymaArtemUKR
1982.8648.223.12:16.0+3.5
38DesthieuxSimonFRA
2685.2447.821.42:07.1+3.6
39DombrovskiKarolLTU
1786.2553.423.12:18.5+3.8
40ChristiansenVetle SjaastadNOR
2286.0050.421.12:10.4+4.4
41DaleJohannesNOR
2683.8152.021.62:18.9+4.7
42GaranichevEvgeniyRUS
1886.5549.823.42:11.2+4.8
43SmolskiAntonBLR
2280.5950.822.22:24.6+5.1
44LaegreidSturla HolmNOR
2692.6246.821.21:49.2+5.3
45GuigonnatAntoninFRA
2581.7549.121.92:18.2+6.6
46MoravecOndrejCZE
1886.0748.722.62:08.8+9.5
47PidruchnyiDmytroUKR
2280.5947.022.82:18.2+10.6
48TrsanRokSLO
1885.1947.823.32:10.2+11.5
49LoginovAlexanderRUS
2486.3249.022.42:08.6+12.0
50NelinJesperSWE
2374.0552.021.72:40.4+13.0
51BrownJakeUSA
1776.0055.030.53:03.1+14.0
52FinelloJeremySUI
1970.3650.422.22:46.6+14.2
53StvrteckyJakubCZE
1971.4356.221.72:54.5+15.1
54KuehnJohannesGER
1675.0053.921.22:40.7+15.2
55BoeJohannes T.NOR
2685.2448.821.12:08.7+18.2


Women

Janina Hettich was the most improved shooter on the women’s side. In her 9 races in 2019โ€“20, she had only managed to hit 70.9% of her targets โ€“ she was 17.7% better this winter. Dzinara Alimbekava wasn’t just the most improved skier, she was also the 2nd-best in terms of shooting improvements (further highlighting her incredible breakout year). Karoline Offigstad Knotten and Dorothea Wierer were the overall most efficient female shooters; they did however lose roughly 20s more on the range compared to Eder/Lรฆgreid (maybe 4-5s of that is down to skiing, the rest is due to slower and less accurate shooting).

Overall World Cup winner, Tiril Eckhoff, improved her shooting somewhat, thanks to a slightly higher hit rate (+1.4%) and a lower shooting time (-1.8s). In general, Eckhoffโ€™s performance stats, in terms of neither skiing nor shooting, improved dramatically; however, her Overall Performance Score nudged 0.1 higher (even with two horrendous races at the season opener). Hanna ร–berg‘s shooting closely followed her skiing form: she was the top shooter in trimester 1 (90.0% hit rate), but it completely fell apart by the end of the season (trimester 3 hit rate: 70.9%).

Changes in Shooting Efficiency | 2019โ€“20 vs. 2020โ€“21

NoFamily NameGiven NameNationRacesHit RateRange TimePenalty LoopTime Loss
Sprint
Change
NoFamily NameGiven NameNationRacesHit RateRange TimePenalty LoopTime Loss
Sprint
Change
1HettichJaninaGER
2488.6154.525.22:17.8-38.9
2AlimbekavaDzinaraBLR
2683.8153.025.12:26.7-28.1
3HaeckiLenaSUI
2179.6947.425.42:26.5-20.1
4MinkkinenSuviFIN
1883.8551.225.92:24.2-15.4
5ZdoucDunjaAUT
2588.7553.524.22:14.2-15.2
6ZukKamilaPOL
1777.2057.225.02:51.5-14.2
7MironovaSvetlanaRUS
2277.9451.223.92:35.1-13.7
8OebergElviraSWE
2582.2550.924.72:25.7-13.5
9HammerschmidtMarenGER
1786.9249.525.92:12.9-13.4
10KnottenKaroline O.NOR
2389.1750.325.72:08.4-13.3
11DavidovaMarketaCZE
2582.7554.023.82:29.1-11.8
12DunkleeSusanUSA
1979.6453.426.32:40.2-9.7
13HinzVanessaGER
2287.0653.324.92:18.8-8.0
14TachizakiFuyukoJPN
1882.3156.725.62:38.8-7.9
15KruchinkinaElenaBLR
2377.2258.825.22:55.0-7.1
16EderMariFIN
1777.0858.824.82:54.3-6.7
17EckhoffTirilNOR
2684.5251.023.02:17.6-6.5
18HerrmannDeniseGER
2581.5052.624.12:29.7-6.3
19SchwaigerJuliaAUT
1984.6454.625.22:27.9-6.1
20LunderEmmaCAN
2285.8849.824.92:14.7-5.0
21Braisaz-BouchetJustineFRA
2676.6753.623.32:41.7-4.1
22CadurischIreneSUI
1679.5748.324.82:27.3-3.9
23GasparinSelinaSUI
1977.5054.623.62:42.2-3.8
24WiererDorotheaITA
2686.9049.023.92:09.3-3.7
25PidhrushnaOlenaUKR
1882.9653.126.02:30.3-3.0
26BrorssonMonaSWE
2284.4153.724.92:26.4-2.0
27DzhimaYuliiaUKR
2186.5652.024.82:17.4-1.9
28Hojnisz-StaregaMonikaPOL
1687.2052.924.62:17.3-1.7
29KuklinaLarisaRUS
1684.0049.424.92:18.7-0.7
30GasparinElisaSUI
2180.9452.024.92:31.4+0.2
31SolaHannaBLR
2370.2749.924.22:51.7+0.2
32PuskarcikovaEvaCZE
1882.6950.426.22:26.1+0.8
33TalihaermJohannaEST
1880.7756.926.12:43.9+1.3
34PerssonLinnSWE
2683.8153.123.92:24.9+2.1
35RoeiselandMarte OlsbuNOR
2685.0050.524.22:17.3+2.1
36TandrevoldIngrid L.NOR
2583.0854.824.12:30.4+2.5
37HauserLisa TheresaAUT
2685.0050.923.02:16.4+4.9
38BescondAnaisFRA
2683.1056.624.22:34.0+5.1
39MaedaSariJPN
1671.8256.625.73:05.8+6.3
40OebergHannaSWE
2684.5248.224.22:13.8+6.7
41GasparinAitaSUI
1983.5751.025.92:24.6+7.3
42VittozziLisaITA
2578.0051.524.42:36.8+8.4
43JislovaJessicaCZE
1777.0856.325.32:50.5+8.8
44EganClareUSA
2381.6757.724.32:40.0+8.9
45PreussFranziskaGER
2686.4350.523.42:12.7+9.7
46SimonJuliaFRA
2675.5048.024.52:36.0+11.0
47BendikaBaibaLAT
1676.6750.524.82:39.0+11.1
48TodorovaMilenaBUL
1976.9056.424.82:50.0+12.2
49CharvatovaLucieCZE
1765.9151.623.13:02.1+12.4
50LieLotteBEL
1890.0055.226.22:16.7+13.5
51BlashkoDaryaUKR
2087.7452.725.02:16.1+14.3
52ChevalierChloeFRA
1878.1557.724.32:48.4+16.3
53InnerhoferKatharinaAUT
1766.6754.424.13:09.2+22.9

Posted in Statistical analysis | Tagged shooting

Wierer in pursuit… of my mind

Posted on 2021-03-28 | by biathlonanalytics | Leave a Comment on Wierer in pursuit… of my mind

In early March I wrote a piece about Wierer’s Pursuit efforts and results, and although I still stand by what I wrote it somehow felt incomplete. In the latest Extra Runde podcast, they brought up again that Wierer seems to do better when starting with a lower bib number in the Pursuit. It feels right, but I couldn’t find the data to support that for Wierer specifically. I did find that the later you start, the more places you can, and typically will, make up, but that applied to all athletes.

Then it struck me (yes, I’m a bit slow sometimes…) there was another way to measure performance in the Pursuit that could be helpful. Look at the Isolated Pursuit time, or in other words the “race time” – “seconds behind at start”. You can also call it the actual race time, and it’s a simple calculation: Total Time – Start Info. The latter has the time an athlete started behind Bib nr. one, the winner of the prior Spring race. Having this Isolated Pursuit time and the ranking of this time would show me her true performance of the day. Plotting that for the last three seasons gives me the following chart:

Now we can see if her start bib is higher her Isolated Race results vary between very good and very bad. Her races with a bib number higher than 15 though are all good to very good for the Isolated Race performance.

Values show change in ranking of isolated race result and start bib (positive = improvement)

If we only take her 8 Pursuit races in the 2020-2021 season we can see she had her best performances when starting lower than 5th and two of her three worst performances when starting 5th or higher. I think it’s fair to say, although based on a small sample size, that the guys from Extra Runde were correct in their assumption. Starting later in the Pursuit races brings up the better performances in Dorothea Wierer. Now they have some data to prove it.

Data from RealBiathlon.com, Feature image from Manzoni/IBU

Posted in Statistical analysis

Posts navigation

Older posts
Newer posts

Recent Articles

  • Junior + U23 Development Index – Men
  • Junior + U23 Development Index – Women
  • The Path to GOAT Status
  • Most improved athletes this winter
  • New biathlon point system

Categories

  • Biathlon Media
  • Biathlon News
  • Long-term trends
  • Statistical analysis
  • Website updates

Archives by Month

  • 2024: J F M A M J J A S O N D
  • 2023: J F M A M J J A S O N D
  • 2022: J F M A M J J A S O N D
  • 2021: J F M A M J J A S O N D
  • 2020: J F M A M J J A S O N D
  • 2015: J F M A M J J A S O N D
  • 2013: J F M A M J J A S O N D
  • 2012: J F M A M J J A S O N D

Search Articles