real biathlon
    • Athletes
    • Teams
    • Races
    • Seasons
    • Scores
    • Records
    • Blog(current)
    • More
      Patreon Content Videos Explanations Shortcuts
      Error Report
      Privacy Policy About
    •     
  • Forum
  • Patreon
  • X
  • YouTube
    Instagram
    Facebook

Recent Articles

  • Junior + U23 Development Index – Men
  • Junior + U23 Development Index – Women
  • The Path to GOAT Status
  • Most improved athletes this winter
  • New biathlon point system

Categories

  • Biathlon Media
  • Biathlon News
  • Long-term trends
  • Statistical analysis
  • Website updates

Archives

  • 2024
    • March
  • 2023
    • March
  • 2022
    • December
    • June
    • May
    • March
    • February
    • January
  • 2021
    • December
    • November
    • September
    • July
    • June
    • May
    • April
    • March
    • February
    • January
  • 2020
    • December
    • November
    • August
    • June
    • March
  • 2015
    • December
  • 2013
    • August
    • July
  • 2012
    • July

Search Articles

Recent Tweets

Tweets by realbiathlon

Year: 2021

Women’s field narrows but men’s stays the same

Posted on 2021-03-26 | by biathlonanalytics | Leave a Comment on Women’s field narrows but men’s stays the same

As a follow up on my previous post, Number of winning athletes doubles in super exciting season, this analysis looks at the narrowing or broadening gap between performances in non-team biathlon races since the 2009-2010 season. Performance, in this case, is measured as the average number of seconds behind the race winner for the 10th, 30th and 60th ranked athletes. So on a seasonal average, how close to the leader are the top 10, top 30 and top 60 in races during the season and how does that compare to previous seasons?

For all charts below, men are on the left, women on the right.

Sprint

For the sprint events, we can see that the men’s field hasn’t changed much over the years and actually has gotten more stable for the top 30 and top 10. For the women, however, we can see the field has narrowed, especially with the “lower” athletes closing in on the top: the top 60 have gone from about 200 seconds back to about 140 seconds back. That’s a minute in just over 10 years! The top 30 and even the top 10 have also come a little closer, meaning the field is compressing and the differences between the fastest and the slowest are getting smaller.

Pursuit

For the pursuit the top 60 was removed as with 60 starters only and always a few DNSs or DNFs there typically is no 60th ranked athlete.

The picture is simular to the Sprint, where the men haven’t realy change much over the years, but the women’s field has significantly narrowed from 0ver 250 seconds behind the leader to about 180 seconds behind, more than a minute for the top 30 to get closer to the lead.

It should be noted that the time behind the lead here includes the time behind the race leader at the start (as per usual in pursuit races), so we’re not using absolute race times here.

Individual & Mass Start

The individual races have seen more fluctuations in the last couple of years for the men, but the gap has remained similar. For the women, again, we see the field closing in by almost a minute-and-a-half by the top60half a minute by the top 30 and about 10 seconds by the top 10. That is quite significant.

Lastly for the mass starts, with only 30 starters and occasionally some athletes not making the finish, we see a small widening of the gap for the men and more or less consistency for the women.

Conclusions

The performance gap for the men has stayed pretty much the same for all events, if anything widening a little for the mass starts. For the women however the gap has declined considerably for all events but mass starts.

An interactive version of the charts can be found here.

Posted in Biathlon News, Statistical analysis | Tagged Seconds behind

Ski speed comparison – 2019โ€“20 vs. 2020โ€“21

Posted on 2021-03-23 | by real biathlon | Leave a Comment on Ski speed comparison – 2019โ€“20 vs. 2020โ€“21

Skiing was once again by far the most important factor to determine an athlete’s eventual World Cup rank. Not only did the two outright fastest skiers, Johannes Thingnes Bรธ and Tiril Eckhoff win the overall title, but out of the ten fastest skiers (per gender), eight made the World Cup top 10 on the men’s side, six on the women’s side. Let’s look at who managed to improve and whose ski speed declined season-to-season.

You can check out full season statistics for all World Cup athletes here:

  • Ski speed: Men | Women
  • Shooting percentage: Men | Women
  • Shooting Times: Men | Women

For patrons, the comparisons page allows you to compare all shooting and skiing stats on your own, not only season-to-season, but also by trimester.


Note: Only athletes with at least 4 non-team races last season and 15 non-team races this winter are included in the tables. “Back from Top30 median” is the percentage back from each race’s top 30 median Course Time (arithmetic mean per season).


Men

Tuomas Harjula and Jeremy Finello were the most improved skiers this season, both roughly 3.5% faster compared to 2019โ€“20. Erik Lesser had an injury-affected winter last year and bounced back to his previous level. Johannes Kรผhn, the fourth-fastest skier last season, never managed recover from a pre-season injury and ended the season with the biggest decline among regular starters.

Johannes Thingnes Bรธ was not as dominating as many expected after the retirement of Martin Fourcade, however, his ski speed was not to blame: he set the top ski time in 20 out of 26 races. Sturla Holm Lรฆgreid improved a lot, albeit he only appeared in four races last winter. Percentage-wise Quentin Fillon Maillet had a big decline in his skiing performances, even though his course times ranks were only 1.9 positions lower and he he finished the season third overall. ร‰milien Jacquelin‘s average was heavily influenced by the WCHs mass start (+12.1%); without that one race his speed would have been roughly 0.5% better.

NoFamily NameGiven NameNationRacesSki Rank
(avg)
Changeback from
Top30 median
(in %)
Change
NoFamily NameGiven NameNationRacesSki Rank
(avg)
Changeback from
Top30 median
(in %)
Change
1HarjulaTuomasFIN
1760.3-27.7+5.05-3.64
2FinelloJeremySUI
1924.3-34.4+0.84-3.47
3KomatzDavidAUT
2246.4-36.6+3.40-3.32
4LesserErikGER
2320.6-28.6+0.50-3.07
5PonsiluomaMartinSWE
268.8-18.3-1.16-2.68
6DovzanMihaSLO
2060.4-20.3+5.26-2.47
7SamuelssonSebastianSWE
2612.0-16.7-0.71-2.17
8LaegreidSturla HolmNOR
2611.2-12.3-0.79-2.16
9LatypovEduardRUS
2517.0-19.0+0.14-2.10
10SmolskiAntonBLR
2225.7-17.0+1.03-1.71
11BocharnikovSergeyBLR
2235.0-14.2+2.09-1.59
12BrownJakeUSA
1731.3-16.0+1.72-1.46
13SimaMichalSVK
1671.1-14.4+6.06-1.31
14GowChristianCAN
2150.1-11.6+3.50-1.24
15HoferLukasITA
269.4-6.3-1.04-1.15
16LangerThierryBEL
1854.6-5.5+4.08-1.03
17DombrovskiKarolLTU
1762.6-7.7+4.92-1.00
18FakJakovSLO
2622.7-7.3+0.70-0.99
19DaleJohannesNOR
265.5-4.4-2.00-0.82
20NelinJesperSWE
2316.2-8.4+0.16-0.79
21StvrteckyJakubCZE
1931.8-6.0+1.61-0.77
22VarabeiMaksimBLR
2041.4-10.3+3.12-0.74
23DudchenkoAntonUKR
1558.5-2.9+4.37-0.64
24GuigonnatAntoninFRA
2522.2+0.2+0.60-0.54
25MukhinAlexandrKAZ
1571.5-3.0+5.85-0.50
26ChristiansenVetle SjaastadNOR
2214.7-2.5-0.37-0.37
27WegerBenjaminSUI
2426.7-2.0+1.21-0.36
28PeifferArndGER
2113.9-1.7-0.39-0.34
29NordgrenLeifUSA
1759.4+1.9+4.40-0.30
30DohertySeanUSA
1947.6-1.9+3.32-0.26
31EderSimonAUT
2633.9-1.6+2.00-0.25
32BormoliniThomasITA
1843.2-3.6+2.96-0.23
33KrcmarMichalCZE
2027.3+0.1+1.28-0.20
34BoeTarjeiNOR
266.4-1.6-1.52-0.20
35BoeJohannes ThingnesNOR
261.7-1.3-3.10-0.20
36SeppalaTeroFIN
2128.0+0.1+1.17-0.17
37GuzikGrzegorzPOL
1562.5-2.1+4.95-0.06
38RastorgujevsAndrejsLAT
1919.8+2.2+0.42-0.04
39LoginovAlexanderRUS
2417.6+0.2+0.10+0.03
40ClaudeFabienFRA
2517.0+2.0+0.08+0.03
41WindischDominikITA
1924.2+1.6+0.82+0.08
42EliseevMatveyRUS
2533.0+5.4+2.17+0.08
43GaranichevEvgeniyRUS
1836.1-0.2+2.36+0.15
44TrsanRokSLO
1870.1-2.7+6.71+0.26
45JacquelinEmilienFRA
2611.8+0.1-0.22+0.27
46DollBenediktGER
2612.2+2.3-0.72+0.28
47PidruchnyiDmytroUKR
2229.8+5.8+1.57+0.32
48DesthieuxSimonFRA
2615.4+3.1-0.18+0.46
49ClaudeFlorentBEL
1945.4+5.2+3.44+0.49
50MoravecOndrejCZE
1844.6+4.9+3.32+0.50
51PrymaArtemUKR
1937.4+9.0+2.23+0.58
52LeitnerFelixAUT
2328.7+5.1+1.50+0.61
53GowScottCAN
1956.4+5.5+4.30+0.65
54StroliaVytautasLTU
1649.9+7.2+3.62+0.65
55FemlingPeppeSWE
2150.5+2.9+3.94+0.70
56Fillon MailletQuentinFRA
257.6+1.9-1.35+0.72
57IlievVladimirBUL
1731.0+9.0+1.61+0.92
58KuehnJohannesGER
1619.5+12.8+0.34+1.69


Women

Dzinara Alimbekava was the most improved skier in the women’s field, skiing an incredible 5.8% faster than last year and lowering her average ski rank by 49.6! Dunja Zdouc managed to improve even more than her Austrian teammate Lisa Theresa Hauser. Skiing 3.9% faster, Hanna Sola set the fastest ski time twice this winter and made her first two career podiums. After setting the fastest ski time in one of the races at the season-opener in Kontiolahti (for the first time in her career), Hanna ร–berg had an abysmal final month of the season.

Tiril Eckhoff dominated the World Cup action after Christmas โ€“ not because of improved skiing however, she remained more or less at the same (high) level as last year. Dorothea Wierer‘s skiing improved slightly over the course of the season, but last year’s World Cup winner was still 1.2% slower, which gave her little chance to defend her title. Denise Herrmann, last winter’s overall fastest saw her ski speed decline considerably, even though she still remained one of the field’s top 5 skiers.

NoFamily NameGiven NameNationRacesSki Rank
(avg)
Changeback from
Top30 median
(in %)
Change
NoFamily NameGiven NameNationRacesSki Rank
(avg)
Changeback from
Top30 median
(in %)
Change
1AlimbekavaDzinaraBLR
2613.8-49.6-0.30-5.79
2ZdoucDunjaAUT
2541.4-35.2+2.92-4.39
3SolaHannaBLR
2311.5-35.9-0.56-3.85
4BeaudrySarahCAN
1566.6-16.5+5.84-3.85
5TomingasTuuliEST
1545.7-30.3+3.80-3.68
6BlashkoDaryaUKR
2044.5-18.3+3.68-3.33
7LieLotteBEL
1872.0-12.8+6.87-3.31
8CadurischIreneSUI
1652.1-18.9+4.13-2.80
9ReidJoanneUSA
1547.5-20.8+3.29-2.74
10HauserLisa TheresaAUT
2611.8-22.8-0.58-2.66
11TodorovaMilenaBUL
1933.9-17.0+2.14-1.84
12OebergElviraSWE
2516.3-9.2-0.11-1.72
13ChevalierChloeFRA
1826.0-18.7+1.25-1.68
14TalihaermJohannaEST
1842.2-12.1+3.10-1.38
15PreussFranziskaGER
2611.5-10.7-0.68-1.34
16SchwaigerJuliaAUT
1937.7-12.8+2.43-1.25
17MaedaSariJPN
1647.4-6.8+3.49-1.07
18CharvatovaLucieCZE
1719.6-5.3+0.50-0.97
19BendikaBaibaLAT
1624.0-9.4+0.85-0.95
20MinkkinenSuviFIN
1867.9-0.9+6.03-0.69
21PerssonLinnSWE
2618.2-4.4+0.16-0.66
22KnottenKaroline OffigstadNOR
2342.7-2.2+3.24-0.65
23GasparinElisaSUI
2145.4-4.8+3.33-0.45
24SimonJuliaFRA
2613.8-0.7-0.55-0.45
25BelchenkoYelizavetaKAZ
1572.3-1.6+7.05-0.40
26TandrevoldIngrid LandmarkNOR
259.3-3.4-0.94-0.39
27GasparinSelinaSUI
1914.4-3.7-0.13-0.30
28KlemencicPolonaSLO
1569.6-2.8+6.56-0.29
29DavidovaMarketaCZE
258.5-2.4-1.05-0.22
30JislovaJessicaCZE
1751.7-1.5+4.02-0.17
31DzhimaYuliiaUKR
2129.8+0.4+1.54-0.08
32MironovaSvetlanaRUS
2220.0+0.8+0.38-0.01
33HettichJaninaGER
2436.4-1.6+2.32+0.02
34RoeiselandMarte OlsbuNOR
265.2-1.9-1.85+0.04
35EganClareUSA
2331.3-0.2+1.95+0.08
36LunderEmmaCAN
2242.0+3.5+2.92+0.14
37HammerschmidtMarenGER
1751.1-0.9+4.26+0.23
38KruchinkinaElenaBLR
2318.8-1.3+0.47+0.25
39EckhoffTirilNOR
264.1-1.4-2.22+0.28
40OebergHannaSWE
2616.8+2.7-0.05+0.34
41GasparinAitaSUI
1950.2+7.0+3.99+0.54
42BescondAnaisFRA
2621.9+4.4+0.73+0.67
43PidhrushnaOlenaUKR
1836.4+7.2+2.33+0.67
44InnerhoferKatharinaAUT
1725.4+7.0+1.03+0.77
45VittozziLisaITA
2526.8+6.8+1.34+0.80
46KryukoIrynaBLR
1540.4+11.9+2.50+0.84
47Braisaz-BouchetJustineFRA
268.3+2.5-1.15+0.86
48EderMariFIN
1719.9+6.4+0.40+1.03
49HinzVanessaGER
2235.1+12.0+2.11+1.07
50TachizakiFuyukoJPN
1855.3+6.7+4.74+1.08
51KuklinaLarisaRUS
1644.5+9.2+3.39+1.12
52WiererDorotheaITA
2617.3+7.2+0.19+1.18
53DunkleeSusanUSA
1946.3+13.3+3.49+1.38
54HaeckiLenaSUI
2131.3+14.3+1.77+1.59
55ZukKamilaPOL
1734.4+13.9+1.99+1.62
56BrorssonMonaSWE
2239.9+12.1+2.98+1.70
57HerrmannDeniseGER
2510.0+7.4-1.02+2.01
58Hojnisz-StaregaMonikaPOL
1634.5+17.5+1.94+2.07
59PuskarcikovaEvaCZE
1860.0+22.9+5.46+2.48

Posted in Statistical analysis | Tagged ski speed

Number of winning athletes doubles in super exciting season

Posted on 2021-03-22 | by biathlonanalytics | Leave a Comment on Number of winning athletes doubles in super exciting season

In the 2019-2020 season, there were six men who won one or more biathlon races. Six. No wonder some people called the sport of biathlon predictable. But the current season looked promising when we reached six halfway through the season. And that trend continued right until the end with another new winner in the last weekend in Hofer.

This analysis looks at how many athletes and nations were represented in the winners’ category for both men and women, the top 3, top 10 and top 30 and how it lined up against previous years.
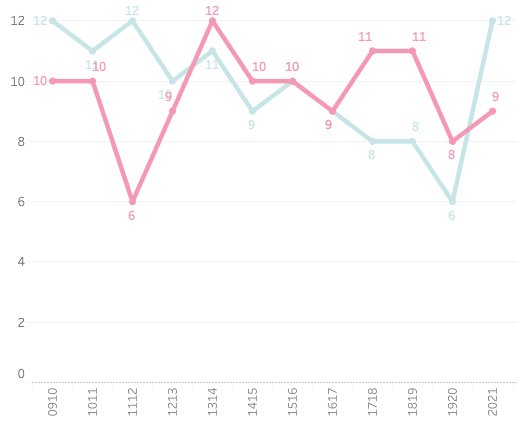
Winners

Last season, all 21 wins were divided between J.T. Boe (10), Fourcade (7), Doll, Fillon Maillet, Jacquelin and Loginov (all one). It was fair to say the winner somewhat predictable. This years’ season however saw 12 winners in 27 events, including the likes of Dale, Desthieux, Hofer, Ponsiluoma, Samuelsson and Laegreid, with the latter winning seven. Perhaps it is unfair to compare 21 to 27 races in a season, but the previous seasons also only saw eight, nine or ten winners in 24, 26, 26 and 25 races respectively.

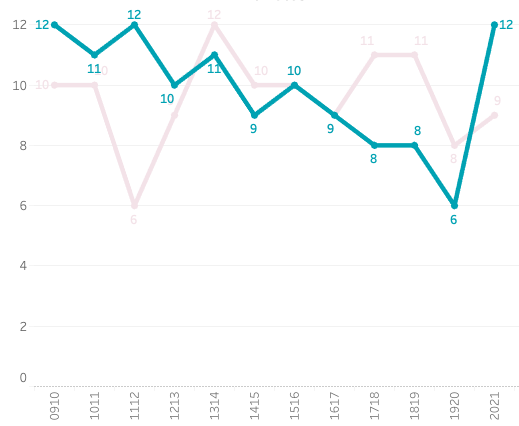
For the women, unfortunately, the trend has continued to go down, although we did have one additional athlete winning, but again in more races than last year. New winners were Alimbekava, Hauser, Davidova and Tandrevold. But with Eckhoff winning 505 of the races (13 out of 26), getting to nine was still pretty good.

When we look at the different Nations amongst the winners, the trends, in general, are still going downwards or at least are staying fairly low. Although Norwegian dominance is impressive, it would be good for the sport if there were more challengers from different Nations as well. Of the 53 races, Norway won 33 of them. The next Nation on that list was France with eight.

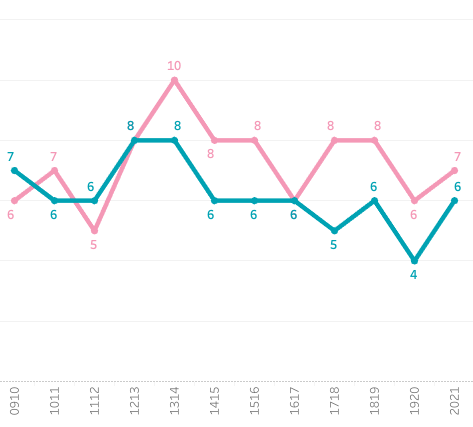
Gold, Silver and Bronze

When looking at all three podium places, we see a similar picture. The men had more athletes than last season, but for both men and women, the long term trend is going downward. The number of Nation represented on the podium has been stable and sits around nine.

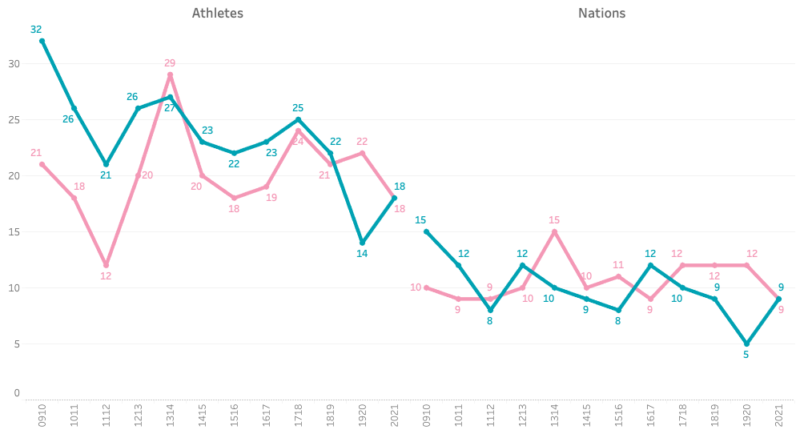
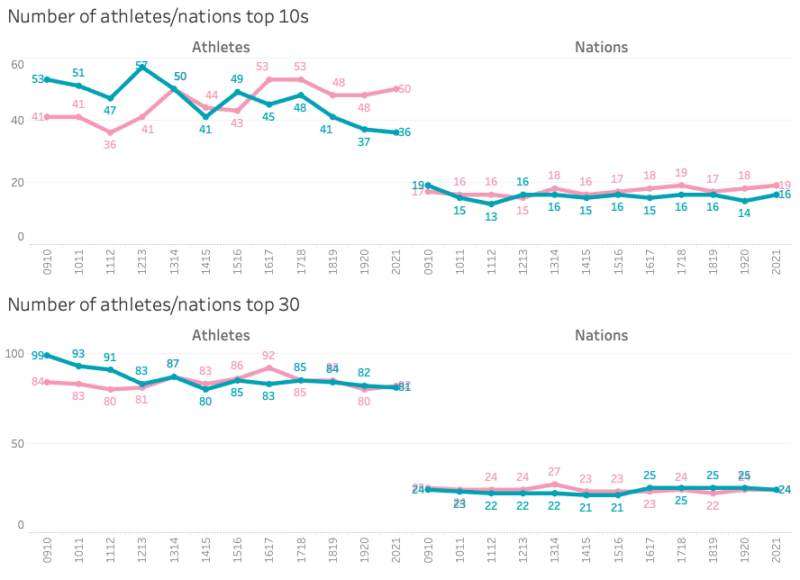
Top 10’s and Top 30’s

When we make the pool of athletes even larger by looking at the Top 10 and Top 30 results, we see the male athletes are slightly declining. the women however are fairly stable (Top 30’s) and even increasing somewhat (top 10’s). On the Nations side both men and women are quite stable with Top 10’s between 19 and 14, and Top 30’s around 24.

Athletes and Nations in summary

When looking at athletes and Nations representing the top places in biathlon we see some promising increases for the athletes, but a somewhat concerning image for the Nations. Hopefully we can see in the next couple of years that other Nations like Belarus, Canada, USA, Austria, Switzerland and Check Republic (and China?) can close the gap and challenge typical biathlon Nations Like Norway, France, Germany, Italy, Sweden and Russia.

If you want to check the charts interactively you can find it on my Tableau Public page.

Posted in Biathlon News, Statistical analysis | Tagged Athletes, Nations, Top performers

Is IBU going the distance?

Posted on 2021-03-15 | by biathlonanalytics | 2 Comments on Is IBU going the distance?

This research was started by a tweet from @realbiathlon:

That was followed up by more tweets from @realbiathlon and @Kristian_Wullf who even looked up some athlete’s Strava records:

Kristian looked up the rules and (I believe) section 3.2.2 specifies that the Women’s Sprint race should be 7,500m in length and can be 2% shorter and 5% longer as measured through the centre of the course, to accommodate the fact that measuring a racecourse to the exact distance can be nearly impossible due to local situations. Based on that information I looked up the course lengths provided by the IBU per Women’s Sprint race and compared that to 7,340m (98% of 7,500) and 7,875 (105%) for all seasons since the 2009-2010 season. Below shows the current and previous two seasons and we can see with a few exceptions the distances are within the limits but vary quite a bit from race to race:

The difference this season between the shortest (Kontiolahti, 7,432m) and longest (Oberhof II, 7,934) is 502m! And that difference is no exception, as we find when looking at the shortest and longest tracks per season:

So the differences can be big, but with a few exceptions, the course lengths are within the rules. Now how did we get here again? Oh, right, about Tiril Eckhof being a fast skier. Now that we know that every Sprint is not exactly 7,500m we cannot compare race times between races. But what we can do is convert the race time to a “7,500m-time” by dividing the race time by the actual (well, at least the provided) course length and multiply that by 7,500. And guess what?

7,500m ski time in seconds

Tiril Eckhof proves to be a super-fast skier, with a top 1, 2, 4, 9 and 19 since the 2009-2010 season. And yeah, everyone knew she was fast. But what I learned from this is the difference between races can be up over 500m, and that’s just looking at Women’s Sprint races.

The raw dashboard used for the visuals above can be found here: https://public.tableau.com/views/WomenSprintCourseLengthAnalysis/Coursetimes?:language=en-GB&:display_count=y&:origin=viz_share_link

Posted in Statistical analysis | Tagged Course length

Wierer’s Pursuit efforts and results

Posted on 2021-03-10 | by biathlonanalytics | Leave a Comment on Wierer’s Pursuit efforts and results

The guys from ExtraRunde, a great podcast about biathlon in German on Mondays and in English for some specials, were discussing that it almost seems that when Wierer starts far behind in the Pursuit her results are often better than when she has a good starting position. This feels to be a correct conclusion, but it is correct according to the data? Time to analyse.

Results

Let’s start by looking at all Wierer’s result in the current season so far:

Wierer’s Pursuit races by starting rank (bib) and places gained or lost

When we look at this same data but in a scatter plot we can draw a trendline that shows things a bit more clear:

Wierer’s starting rank -vs- places gained

So it appears that indeed when Wierer starts later in the Pursuit competitions, her results regarding catching up positions get better. But that’s only for 6 races. Now let’s do the same charts but for Wierer’s Pursuit races in the current and two previous seasons:

Same as above for three seasons (2021 still ongoing)

Now we have 19 races and the trend is still there. There is a bit of a catch with looking at the number of places gained: when you start first, there are only places to lose; when you start last, there are only places to gain. So this trend is kind of what you could expect: as there are more places to gain and less to lose you tend to gain more. Let’s look at all pursuit races since the 2018-2019 season and look at all athletes while removing the DNF’s etc.:

This shows the same trend, so we can confirm what we already figured out above, the more opportunities you have to gain positions, the more you will gain, and the other way around.

Other measurements

Can we look more specifically at particular measurements that can express Wierer’s performance, other than Bib and Rank, or even time behind at the start and at the finish? Is perhaps her shooting better if she starts further down, or her ski times? Her shooting does actually get worse the further behind she starts:

Wierer’s starting time -vs- total shooting percentage

And her skiing?

Wierer’s starting time -vs- ski/course time

The only thing I can say about her skiing is that when Wierer’s starting time behind increases the variation becomes a bit bigger. But more importantly, what goes both for shooting and skiing, it is fair to assume that as Wierer starts further behind based on worse results in the sprint, her shape is likely not at her peak. With that in mind, if her shape is not great, her skiing and shooting will also not be great, which could explain the shooting trend. Another fact to consider, which mostly impacts her shooting, is that the further back she starts, the more risk she will be taking to catch up to the lead, pushing a little harder on the skis, leading to more misses in the range.

Conclusion

I can say that yes, as the starts later, her number of places gained is higher. But this applies to all athletes. To say that she does better when she has more places to catch up makes sense as much for her as it does for anyone else.

Posted in Statistical analysis | Tagged pursuit, Wierer

Posts navigation

Older posts
Newer posts

Recent Articles

  • Junior + U23 Development Index – Men
  • Junior + U23 Development Index – Women
  • The Path to GOAT Status
  • Most improved athletes this winter
  • New biathlon point system

Categories

  • Biathlon Media
  • Biathlon News
  • Long-term trends
  • Statistical analysis
  • Website updates

Archives by Month

  • 2024: J F M A M J J A S O N D
  • 2023: J F M A M J J A S O N D
  • 2022: J F M A M J J A S O N D
  • 2021: J F M A M J J A S O N D
  • 2020: J F M A M J J A S O N D
  • 2015: J F M A M J J A S O N D
  • 2013: J F M A M J J A S O N D
  • 2012: J F M A M J J A S O N D

Search Articles