real biathlon
    • Athletes
    • Teams
    • Races
    • Seasons
    • Scores
    • Records
    • Blog(current)
    • More
      Patreon Content Videos Explanations Shortcuts
      Error Report
      Privacy Policy About
    •     
  • Forum
  • Patreon
  • X
  • YouTube
    Instagram
    Facebook

Recent Articles

  • Junior + U23 Development Index – Men
  • Junior + U23 Development Index – Women
  • The Path to GOAT Status
  • Most improved athletes this winter
  • New biathlon point system

Categories

  • Biathlon Media
  • Biathlon News
  • Long-term trends
  • Statistical analysis
  • Website updates

Archives

  • 2024
    • March
  • 2023
    • March
  • 2022
    • December
    • June
    • May
    • March
    • February
    • January
  • 2021
    • December
    • November
    • September
    • July
    • June
    • May
    • April
    • March
    • February
    • January
  • 2020
    • December
    • November
    • August
    • June
    • March
  • 2015
    • December
  • 2013
    • August
    • July
  • 2012
    • July

Search Articles

Recent Tweets

Tweets by realbiathlon

Month: March 2021

Number of winning athletes doubles in super exciting season

Posted on 2021-03-22 | by biathlonanalytics | Leave a Comment on Number of winning athletes doubles in super exciting season

In the 2019-2020 season, there were six men who won one or more biathlon races. Six. No wonder some people called the sport of biathlon predictable. But the current season looked promising when we reached six halfway through the season. And that trend continued right until the end with another new winner in the last weekend in Hofer.

This analysis looks at how many athletes and nations were represented in the winners’ category for both men and women, the top 3, top 10 and top 30 and how it lined up against previous years.

Winners

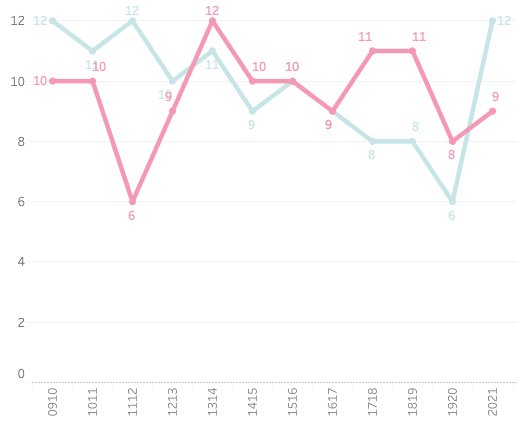
Last season, all 21 wins were divided between J.T. Boe (10), Fourcade (7), Doll, Fillon Maillet, Jacquelin and Loginov (all one). It was fair to say the winner somewhat predictable. This years’ season however saw 12 winners in 27 events, including the likes of Dale, Desthieux, Hofer, Ponsiluoma, Samuelsson and Laegreid, with the latter winning seven. Perhaps it is unfair to compare 21 to 27 races in a season, but the previous seasons also only saw eight, nine or ten winners in 24, 26, 26 and 25 races respectively.
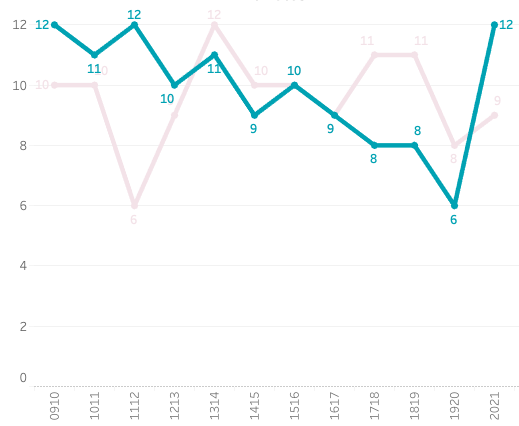
For the women, unfortunately, the trend has continued to go down, although we did have one additional athlete winning, but again in more races than last year. New winners were Alimbekava, Hauser, Davidova and Tandrevold. But with Eckhoff winning 505 of the races (13 out of 26), getting to nine was still pretty good.
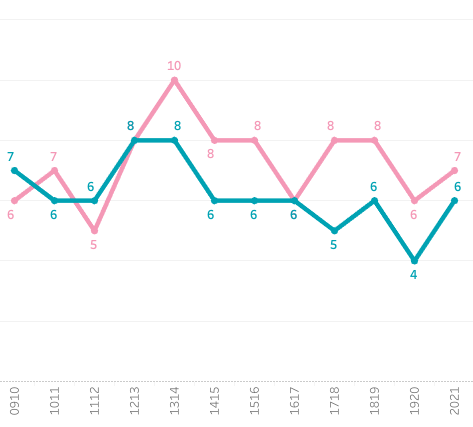
When we look at the different Nations amongst the winners, the trends, in general, are still going downwards or at least are staying fairly low. Although Norwegian dominance is impressive, it would be good for the sport if there were more challengers from different Nations as well. Of the 53 races, Norway won 33 of them. The next Nation on that list was France with eight.
Gold, Silver and Bronze

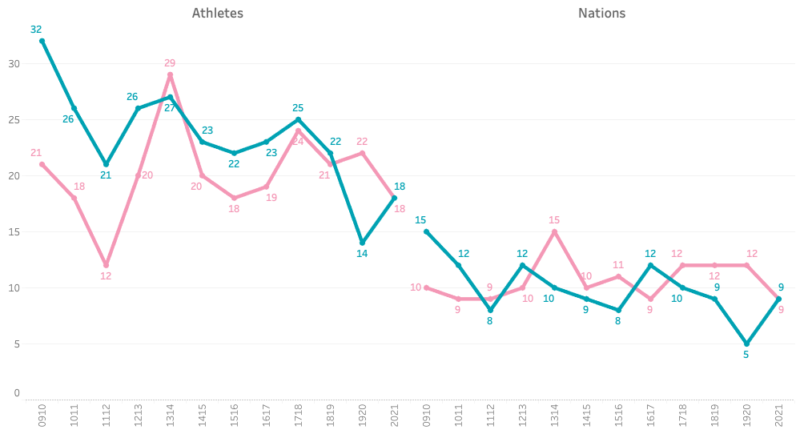
When looking at all three podium places, we see a similar picture. The men had more athletes than last season, but for both men and women, the long term trend is going downward. The number of Nation represented on the podium has been stable and sits around nine.
Top 10’s and Top 30’s

When we make the pool of athletes even larger by looking at the Top 10 and Top 30 results, we see the male athletes are slightly declining. the women however are fairly stable (Top 30’s) and even increasing somewhat (top 10’s). On the Nations side both men and women are quite stable with Top 10’s between 19 and 14, and Top 30’s around 24.
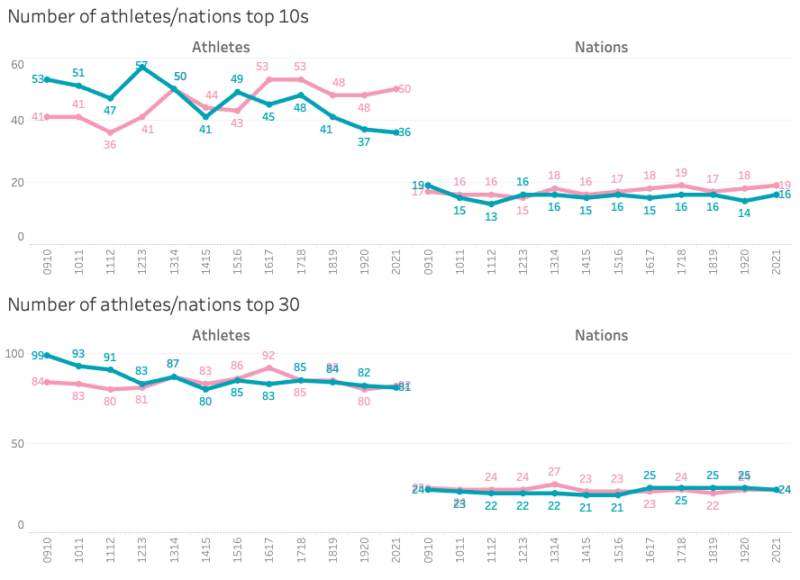
Athletes and Nations in summary

When looking at athletes and Nations representing the top places in biathlon we see some promising increases for the athletes, but a somewhat concerning image for the Nations. Hopefully we can see in the next couple of years that other Nations like Belarus, Canada, USA, Austria, Switzerland and Check Republic (and China?) can close the gap and challenge typical biathlon Nations Like Norway, France, Germany, Italy, Sweden and Russia.

If you want to check the charts interactively you can find it on my Tableau Public page.

Posted in Biathlon News, Statistical analysis | Tagged Athletes, Nations, Top performers

Is IBU going the distance?

Posted on 2021-03-15 | by biathlonanalytics | 2 Comments on Is IBU going the distance?

This research was started by a tweet from @realbiathlon:

That was followed up by more tweets from @realbiathlon and @Kristian_Wullf who even looked up some athlete’s Strava records:

Kristian looked up the rules and (I believe) section 3.2.2 specifies that the Women’s Sprint race should be 7,500m in length and can be 2% shorter and 5% longer as measured through the centre of the course, to accommodate the fact that measuring a racecourse to the exact distance can be nearly impossible due to local situations. Based on that information I looked up the course lengths provided by the IBU per Women’s Sprint race and compared that to 7,340m (98% of 7,500) and 7,875 (105%) for all seasons since the 2009-2010 season. Below shows the current and previous two seasons and we can see with a few exceptions the distances are within the limits but vary quite a bit from race to race:

The difference this season between the shortest (Kontiolahti, 7,432m) and longest (Oberhof II, 7,934) is 502m! And that difference is no exception, as we find when looking at the shortest and longest tracks per season:

So the differences can be big, but with a few exceptions, the course lengths are within the rules. Now how did we get here again? Oh, right, about Tiril Eckhof being a fast skier. Now that we know that every Sprint is not exactly 7,500m we cannot compare race times between races. But what we can do is convert the race time to a “7,500m-time” by dividing the race time by the actual (well, at least the provided) course length and multiply that by 7,500. And guess what?

7,500m ski time in seconds

Tiril Eckhof proves to be a super-fast skier, with a top 1, 2, 4, 9 and 19 since the 2009-2010 season. And yeah, everyone knew she was fast. But what I learned from this is the difference between races can be up over 500m, and that’s just looking at Women’s Sprint races.

The raw dashboard used for the visuals above can be found here: https://public.tableau.com/views/WomenSprintCourseLengthAnalysis/Coursetimes?:language=en-GB&:display_count=y&:origin=viz_share_link

Posted in Statistical analysis | Tagged Course length

Wierer’s Pursuit efforts and results

Posted on 2021-03-10 | by biathlonanalytics | Leave a Comment on Wierer’s Pursuit efforts and results

The guys from ExtraRunde, a great podcast about biathlon in German on Mondays and in English for some specials, were discussing that it almost seems that when Wierer starts far behind in the Pursuit her results are often better than when she has a good starting position. This feels to be a correct conclusion, but it is correct according to the data? Time to analyse.

Results

Let’s start by looking at all Wierer’s result in the current season so far:

Wierer’s Pursuit races by starting rank (bib) and places gained or lost

When we look at this same data but in a scatter plot we can draw a trendline that shows things a bit more clear:

Wierer’s starting rank -vs- places gained

So it appears that indeed when Wierer starts later in the Pursuit competitions, her results regarding catching up positions get better. But that’s only for 6 races. Now let’s do the same charts but for Wierer’s Pursuit races in the current and two previous seasons:

Same as above for three seasons (2021 still ongoing)

Now we have 19 races and the trend is still there. There is a bit of a catch with looking at the number of places gained: when you start first, there are only places to lose; when you start last, there are only places to gain. So this trend is kind of what you could expect: as there are more places to gain and less to lose you tend to gain more. Let’s look at all pursuit races since the 2018-2019 season and look at all athletes while removing the DNF’s etc.:

This shows the same trend, so we can confirm what we already figured out above, the more opportunities you have to gain positions, the more you will gain, and the other way around.

Other measurements

Can we look more specifically at particular measurements that can express Wierer’s performance, other than Bib and Rank, or even time behind at the start and at the finish? Is perhaps her shooting better if she starts further down, or her ski times? Her shooting does actually get worse the further behind she starts:

Wierer’s starting time -vs- total shooting percentage

And her skiing?

Wierer’s starting time -vs- ski/course time

The only thing I can say about her skiing is that when Wierer’s starting time behind increases the variation becomes a bit bigger. But more importantly, what goes both for shooting and skiing, it is fair to assume that as Wierer starts further behind based on worse results in the sprint, her shape is likely not at her peak. With that in mind, if her shape is not great, her skiing and shooting will also not be great, which could explain the shooting trend. Another fact to consider, which mostly impacts her shooting, is that the further back she starts, the more risk she will be taking to catch up to the lead, pushing a little harder on the skis, leading to more misses in the range.

Conclusion

I can say that yes, as the starts later, her number of places gained is higher. But this applies to all athletes. To say that she does better when she has more places to catch up makes sense as much for her as it does for anyone else.

Posted in Statistical analysis | Tagged pursuit, Wierer
SkootBiathlonBoardgameLogo

SKOOT – a D.I.Y. Biathlon board game

Posted on 2021-03-05 | by biathlonanalytics | Leave a Comment on SKOOT – a D.I.Y. Biathlon board game
SKOOT logo

SKOOT is a Biathlon board game that you make yourself with a printer and some glue or tape, a few dice and some playing tokens (lego works great). It is based on rolling dice and making strategic decisions, in which competitors ski three loops and shoot twice. For the skiing part, the effort is based on tactics and players use dice to determine the number of tiles they go along the course. The shooting success is determined by a tactical decision and rolling a die for each of the five targets. The game is easy to learn and can be played by young and old, and anywhere in between. It comes in a basic version suitable for younger kids (eight and younger) or you can use an add-on to make the tactics more involved.

Required to play the game

  • The board with the ski track, a recovery area, a shooting area, a penalty loop and a finish section – to be printed
  • At minimum five dice, but ideally eight dice (two for skiing, one for recovery and five for shooting)
  • A token for every racer (Lego one-size blocks work quite well)
  • A token of the same colour for the Heart Rate Meter when playing the Heart Rate Meter Add-on
  • A piece of paper to write down the tactics per player per lap (lap one and two only), recovery, missed shots; see example below. Only for the game played without the Heart Rate Meter Add-on

Files to be printed

For any of the files, please go to https://biathlonanalytics.com/skootbiathlonboardgame/ where everything is available for free.

Posted in Biathlon Media | Tagged boardgame, DIY
An exploration of Biathlon Relay Race data

Exploring Biathlon Relay race data

Posted on 2021-03-05 | by biathlonanalytics | Leave a Comment on Exploring Biathlon Relay race data

So far I have only worked with data from the individual races, but I wanted to familiarize myself more with the relay data. So I took yesterday’s crazy women’s race and did some research on their relay.

Progression of the race by rank

Team average skiing and shooting times

Note: the axis are reversed, so top right is good, bottom left not so good

Noticeable is Kazakhstan, not one of the most prominent countries in biathlon at this point, who ranked second in fastest Average Range Time. Not let’s see how their (and other countries’) shooting went:

Shooting

With only two reloads, it is no wonder Kazakhstan had a very good Range Time. Czech Republic had a horrible day at the range with 5 penalty loops and 16 reloads. Sweden, the eventual winner, had 6 reloads.

When we look at the combined efforts of all team members per team, we can see what the spread was within the teams. The closer they were, the more consistent they raced as a team. The following chart has four columns per team: the total leg time per athlete per team, also showing the team’s spread; the average leg time for the team; the spread expressed in Standard Deviation; and the average range time per team:

Spread within team

This shows that Sweden and Belarus were very consistent as a team, as were Germany, Poland and Japan for example. On the other hand Norway had some great performances, but also some weak ones, not very consistent. Finland had the biggest spread.

If we start digging one layer deeper, let’s look at the Top 5, Canada and USA and who their best performers were, based on total course time per leg (coloured bars) and their three course-laps course times (dots: light blue is course 1, dark blue is course 3). The athletes are sorted within their teams based on the best total course times:

Teams’ best performers

The chart above also shows how consistent their three-course times were; the closer together, the more consistent. I all cases the third course was the fastest, which makes sense as they have done their shooting by then and can go all-out. The following shows, again for only the Top 5, Canada and USA, the right column from above in more detail and has ordered by athletes with the fastest course time (in every case their third):

Fastest course times

Not shockingly, Tiril Eckhoff had the fastest course time in her third course. Tandrevold was third, but Roeiseland and Lien were 12th and 15th.

Lastly, we can look at individual performances. I recommend going to the interactive version of the report, and when hovering your mouse over the name of a column, you can click the sort ascending or descending button to see who’s best, and who is not. Below I show the Top 15 athletes per measurement:

Individual performances

Best total time per leg (three loops, skiing and shooting)
Best total skiing time per leg (three loops, skiing only)
Best time of fastest course time (one course, skiing only)
Best time for total shooting time per leg (two shootings)
Best time for total range time per leg (two shootings)

This concludes my examination for now, but now that I am more familiar with the relay data, I’m sure you’ll find more research and postings about relays in the future. Cheers!

Posted in Statistical analysis | Tagged Data, Relay

Posts navigation

Newer posts

Recent Articles

  • Junior + U23 Development Index – Men
  • Junior + U23 Development Index – Women
  • The Path to GOAT Status
  • Most improved athletes this winter
  • New biathlon point system

Categories

  • Biathlon Media
  • Biathlon News
  • Long-term trends
  • Statistical analysis
  • Website updates

Archives by Month

  • 2024: J F M A M J J A S O N D
  • 2023: J F M A M J J A S O N D
  • 2022: J F M A M J J A S O N D
  • 2021: J F M A M J J A S O N D
  • 2020: J F M A M J J A S O N D
  • 2015: J F M A M J J A S O N D
  • 2013: J F M A M J J A S O N D
  • 2012: J F M A M J J A S O N D

Search Articles