Two years ago I first looked at long-term trends in biathlon statistics, mainly to find out whether today’s athletes are better than previous generations, and how performance levels in the sport are developing in general. I now had another look at it, in order to see if anything had changed during the last two seasons (I haven’t included the currently ongoing season, because partial stats can be misleading). Here are the non-team shooting percentages over the last 14 seasons.
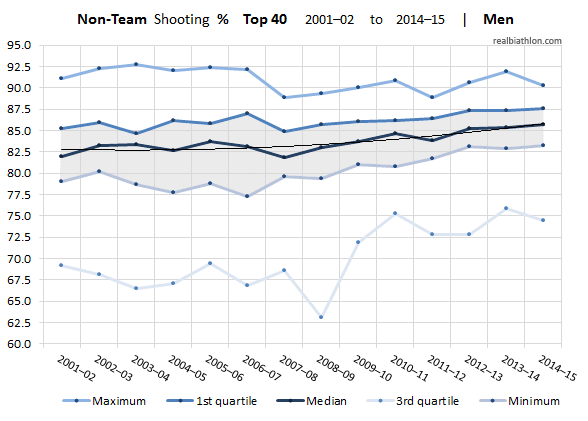
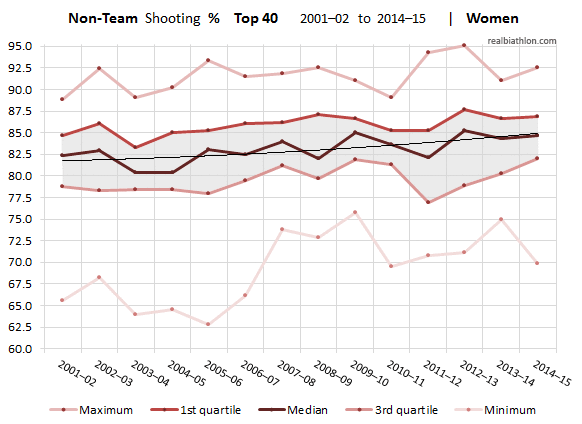
The stats are for the men’s and women’s overall World Cup top 40 (per season). I looked at their non-team percentages, split into quartiles. Quartiles divide the data into four equal groups (of 25 % each), i.e. the grey space between the 1st and 3rd quartile in the chart represents 50 % of the top 40 athletes. Unlike standard statistical methods, such as the average, the use of quartiles (like the median = 2nd quartile) is statistically a more robust method and more resistant to outliers.

In men’s World cup races, both the top 40’s median and the top 40’s average has improved by more than 3% since 2001–02. Last season was one of the best years shooting-wise, only the maximum (most accurate shooter) is clearly lower than in past years (in the first half of the last decade), but the median and 1st/3rd quartiles were at an all-time high in 2014–15, continuing the upward trend since the early 2000s. The worst shooter of the top 40 hits over 70% since 2009–10, before that the worst shooter always had a hit rate below 70%.
| Top 40 | 2001
–02 | 2002
–03 | 2003
–04 | 2004
–05 | 2005
–06 | 2006
–07 | 2007
–08 | 2008
–09 | 2009
–10 | 2010
–11 | 2011
–12 | 2012
–13 | 2013
–14 | 2014
–15 | Diff. |
| Maximum | 91.1 | 92.3 | 92.7 | 92.0 | 92.4 | 92.1 | 88.9 | 89.3 | 90.0 | 90.9 | 88.9 | 90.6 | 91.9 | 90.3 | -0.8 |
| 1st quartile | 85.2 | 85.9 | 84.7 | 86.1 | 85.8 | 87.0 | 84.9 | 85.7 | 86.0 | 86.1 | 86.3 | 87.3 | 87.3 | 87.6 | +2.4 |
| Median | 81.9 | 83.2 | 83.3 | 82.6 | 83.7 | 83.1 | 81.8 | 83.0 | 83.7 | 84.6 | 83.8 | 85.2 | 85.3 | 85.8 | +3.8 |
| 3rd quartile | 79.0 | 80.1 | 78.7 | 77.7 | 78.8 | 77.2 | 79.6 | 79.3 | 81.0 | 80.8 | 81.7 | 83.2 | 82.9 | 83.2 | +4.2 |
| Minimum | 69.2 | 68.1 | 66.5 | 67.1 | 69.4 | 66.9 | 68.6 | 63.0 | 71.9 | 75.3 | 72.8 | 72.8 | 75.8 | 74.5 | +5.3 |
| 2001
–02 | 2002
–03 | 2003
–04 | 2004
–05 | 2005
–06 | 2006
–07 | 2007
–08 | 2008
–09 | 2009
–10 | 2010
–11 | 2011
–12 | 2012
–13 | 2013
–14 | 2014
–15 | Diff. |
| Top 10 avg | 84.2 | 82.7 | 82.0 | 87.7 | 84.2 | 87.8 | 83.9 | 85.4 | 84.7 | 85.4 | 85.8 | 87.0 | 86.8 | 86.6 | +2.4 |
| Top 20 avg | 83.5 | 84.3 | 82.2 | 84.5 | 84.4 | 85.8 | 83.8 | 83.6 | 83.6 | 84.7 | 84.6 | 86.5 | 85.7 | 86.2 | +2.8 |
| Top 40 avg | 81.5 | 83.0 | 81.9 | 81.8 | 82.4 | 82.2 | 81.5 | 82.1 | 83.3 | 83.7 | 83.7 | 84.7 | 85.0 | 84.9 | +3.4 |
| Top 60 avg | 81.0 | 81.5 | 80.3 | 81.1 | 82.2 | 82.2 | 81.2 | 81.5 | 81.9 | 82.6 | 82.5 | 84.1 | 84.3 | 83.9 | +2.9 |
Diff.–difference between 2001–02 and 2014–15 seasons
The women’s shooting results look very similar to the men’s. For the last 14 seasons they have been creeping higher, although not by quite as much. They improved by more than 2% (the mean is currently 2.3% higher, the average is 2.5% higher than 2001–02). For 2014–15, the men’s median shooter was slightly better than the women’s (85.8% vs. 84.7%), although there have been seasons where it was the other way around.
| Top 40 | 2001
–02 | 2002
–03 | 2003
–04 | 2004
–05 | 2005
–06 | 2006
–07 | 2007
–08 | 2008
–09 | 2009
–10 | 2010
–11 | 2011
–12 | 2012
–13 | 2013
–14 | 2014
–15 | Diff. |
| Maximum | 88.9 | 92.4 | 89.0 | 90.3 | 93.3 | 91.5 | 91.8 | 92.6 | 91.0 | 89.0 | 94.3 | 95.1 | 91.1 | 92.6 | +3.7 |
| 1st quartile | 84.6 | 86.1 | 83.2 | 85.0 | 85.2 | 86.0 | 86.2 | 87.1 | 86.6 | 85.3 | 85.2 | 87.6 | 86.7 | 86.9 | +2.3 |
| Median | 82.4 | 83.0 | 80.3 | 80.3 | 83.0 | 82.4 | 84.0 | 82.1 | 85.0 | 83.6 | 82.2 | 85.3 | 84.3 | 84.7 | +2.3 |
| 3rd quartile | 78.8 | 78.4 | 78.4 | 78.4 | 78.0 | 79.5 | 81.2 | 79.7 | 81.9 | 81.3 | 76.9 | 78.9 | 80.3 | 82.0 | +3.2 |
| Minimum | 65.6 | 68.2 | 64.0 | 64.5 | 62.8 | 66.2 | 73.8 | 72.9 | 75.8 | 69.5 | 70.8 | 71.1 | 75.0 | 69.8 | +4.2 |
| 2001
–02 | 2002
–03 | 2003
–04 | 2004
–05 | 2005
–06 | 2006
–07 | 2007
–08 | 2008
–09 | 2009
–10 | 2010
–11 | 2011
–12 | 2012
–13 | 2013
–14 | 2014
–15 | Diff. |
| Top 10 avg | 83.3 | 84.6 | 81.2 | 81.2 | 84.8 | 84.1 | 85.7 | 84.2 | 85.9 | 83.8 | 86.1 | 82.9 | 85.1 | 85.7 | +2.4 |
| Top 20 avg | 81.3 | 84.3 | 81.3 | 82.6 | 83.7 | 83.9 | 84.4 | 84.4 | 85.7 | 82.8 | 84.4 | 83.3 | 85.3 | 84.8 | +3.5 |
| Top 40 avg | 81.3 | 82.1 | 80.2 | 81.1 | 81.7 | 82.4 | 83.7 | 83.0 | 84.4 | 83.0 | 81.7 | 83.4 | 83.9 | 83.8 | +2.5 |
| Top 60 avg | 80.4 | 80.7 | 79.4 | 79.8 | 81.1 | 81.4 | 82.1 | 81.9 | 83.6 | 81.8 | 81.3 | 81.7 | 82.8 | 82.7 | +2.3 |
Diff.–difference between 2001–02 and 2014–15 seasons
The shooting results in general continue to improve across the board. It’s impossible to say by how much exactly, results differ a lot depending on what group you look at or what method you use. To put a number on it, I’d say non-team shooting percentages are roughly 2-3% higher now than they were back in 2001–02. It’s unclear how much they can improve further before hitting a ceiling, because unlike ski speed, the hit rate has an absolute limit at 100%.
About Post Author
Creator of the website realbiathlon.com