real biathlon
    • Athletes
    • Teams
    • Races
    • Seasons
    • Scores
    • Records
    • Blog(current)
    • More
      Patreon Content Videos Explanations Shortcuts
      Error Report
      Privacy Policy About
    •     
  • Forum
  • Patreon
  • X
  • YouTube
    Instagram
    Facebook

Recent Articles

  • Junior + U23 Development Index – Men
  • Junior + U23 Development Index – Women
  • The Path to GOAT Status
  • Most improved athletes this winter
  • New biathlon point system

Categories

  • Biathlon Media
  • Biathlon News
  • Long-term trends
  • Statistical analysis
  • Website updates

Archives

  • 2024
    • March
  • 2023
    • March
  • 2022
    • December
    • June
    • May
    • March
    • February
    • January
  • 2021
    • December
    • November
    • September
    • July
    • June
    • May
    • April
    • March
    • February
    • January
  • 2020
    • December
    • November
    • August
    • June
    • March
  • 2015
    • December
  • 2013
    • August
    • July
  • 2012
    • July

Search Articles

Recent Tweets

Tweets by realbiathlon

Year: 2021

Latest website features

Posted on 2021-04-16 | by real biathlon | Leave a Comment on Latest website features

With the season behind us, I thought it would be a good idea to summarize the updates and new features I added to the website over the last 2-3 months. Most of them are a little hidden and not everyone will immediately see them or even be aware they are available. It’s probably useful to give a quick overview.

Histograms

I added histograms for all athlete and team pages (which previously only had line chart or box plot visualizations). I think it’s an interesting addition, particularly for shooting percentages, or to give a better overview of shooting pace and skiing speed distributions. Just like line charts, you can directly compare two athletes.

Aย histogram is an approximate representation of the distribution of numerical data. In aย histogram, each bar groups numbers into ranges. Taller bars show that more data falls in that range. Aย histogramย displays the shape and spread of continuous sample data.

Examples:

  • Shooting percentage distribution 2020โ€“21: Sturla Holm Lรฆgreid
  • Ski speed comparison: Hanna ร–berg vs. Tiril Eckhoff

Ski Speed per Loop

Some athletes seem to get faster over the course of a race, while others appear to tire more quickly than the field. To quantify this a little better and find out who has particularly strong final laps, I calculated the ski speed (back from top 30 median) for each of the 3/5 ski loops. You can visualize them either as box plots or line charts (for overall career, per season, per discipline, etc).

Examples:

  • Box Plots for each Ski Loop: Dorothea Wierer
  • Box plots for Teams: Austria Mixed

Examples:

  • Line charts per Race: Comparison Dorothea Wierer vs. Hanna ร–berg
  • Line chart per Season: Johannes Thingnes Bรธ

Head-to-head comparison

For all races, you can now compare two athletes directly. All time data (course times, shooting times, range times, etc.) is visualized through a diverging bar chart, while some other data (shooting intervals, hits/misses) are shown side by side in a table.

Examples:

  • Head-to-head comparison: Johannes Thingnes Bรธ vs. Sturla Holm Lรฆgreid
  • Head-to-head team comparison: Norway vs. Germany

Video links

All race pages (since 2010โ€“11) now have direct links to the Eurovision Sports website which hosts the official IBU videos. If available, the links usual include race replay, press conference, highlights and zeroing. For Olympic races, I linked videos from Olympic.org.

Bonus content for patrons

  • New data set of World Cup prize money: For all seasons since 2003โ€“04, as well as cumulative all-time biathlon prize money data (since 2004).
  • Improved Comparison page: You can now compare stats not only season-to-season, but also by World Cup trimesters within a season. For example: This season’s ski speed changes January to March
  • Stats for each World Cup venue: You can look up all podium finishers, shooting results, shooting times and skiing stats for each World Cup location. I also added weather info for each race. Most data can be visualized.
Posted in Website updates | Tagged Data subscription, data visualization

Canadian biathletes finding balance

Posted on 2021-04-06 | by biathlonanalytics | Leave a Comment on Canadian biathletes finding balance

With three top 10s, sixteen top 20s and twenty-five top 30s in individual events, the 2020-2021 season was the best Canadian season in the last five years. After a dip in total World cup points in the 2019-2020 season, last season continued on the five-year trend of continuous increase in total world cup points:

So what did Canada do well to get here, and where is there still room for improvement? That is what the following review of the Canadian individual performances in the 2020-2021 season will analyse! In this analysis, I will only show some examples of Canadian performances, but a supportive dashboard with all used data for this analysis can be found on my Tableau Public page. It shows all stats for the Canadian team, both men and women, and has a second tab where a Canadian athlete can be selected to show his or her specific stats.

Skiing time

The skiing is still the area where the Canadian team overall can gain the most time. In the specific example below I compare the average ski times of the Canadian athletes to the field average, the average of the top 30 athletes, and the average of the top 10 athletes:

Although we can see Canada is closing up the gap a little compared to last season, we are still behind the overall average, and far behind the top 10 athletes. But the positive news is that we made great progress in the 2020-2021 season, indicated by the steep drop towards the averages.

Shooting time

This is where Canada has the least to gain (and the most to loose) as we continue to be very strong in fast shooting, leading many of the true biathlon nations:

Shooting accuracy

In previous seasons the fast shooting times by the Canadians often lead to less desired shooting percentages, but it appears the team and coaches are starting to find a balance between shooting fast and shooting accurate, demonstrated by both increased accuracy in Prone and Standing:

Shooting speed -vs- Accuracy

This balance between shooting fast and clean is of course the golden grail of shooting in biathlon (I wrote about this in more depth on this website in December last year). The chart below shows how this balance has changed for the different team, starting in 2016-2017 (thin line) and how teams have moved from shooting more or less accurate, and faster or slower. We see that in 2018-2019 team Canada put a lot of focus on shooting faster, which worked, but at the expense of less accuracy. Now we see that we have lost some speed (but are still very fast) but have gained accuracy. Hopefully, this trend can continue upwards towards more accuracy while remaining fast.

Individuals

The second part of the evaluation is looking at the individual athletes. All Canadian athletes can be viewed on the interactive dashboard, but here I’m letting Emma Lunder be the example here. We can see that here Accuracy -vs- Speed trend is similar to the Team’s and that she is gaining accuracy while giving up a little speed. But we can also see that here range, shooting and prep time (prep = range – shooting) is still very good and well below the field’s average:

Her total percentage of shooting accuracy (T) has increased mostly based on a strong increase in her prone shooting (P) and she well above the field’s average Total shooting percentage (T avg.). Lastly her skiing speed seems to have stabilized and is on par with the field’s average. But she is also closing the gap with the Top 30 and Top 10 averages.

Conclusion

As mentioned team Canada had a great season, as did Emma Lunder. The above will hopefully give a good explanation of how to read the interactive dashboard to see both men’s and women’s team performances for individual races, and the individual dashboards for any of the Canadian athletes. If the current trends continue and with some of the younger athletes coming through the pipeline, hopefully, we can some Canadian podiums in the next season! Go Canada!

Posted in Biathlon Media, Long-term trends, Statistical analysis

Shooting Efficiency: 2019โ€“20 vs. 2020โ€“21

Posted on 2021-03-30 | by real biathlon | Leave a Comment on Shooting Efficiency: 2019โ€“20 vs. 2020โ€“21

After examining changes in skiing speed, let’s also look at a comparison of overall shooting quality between the 2019โ€“20 and the 2020โ€“21 seasons for all regular Biathlon World Cup athletes. To do that, I came up with the concept of Shooting Efficiency, an attempt to combine shooting accuracy and shooting time into one metric. For more details how it’s calculated, see here.

If you can’t find a specific athlete, you can look up the complete World Cup field (also available per trimester) for latest season (as well as all previous seasons) here:

  • 2020โ€“21 Shooting Efficiency: Men | Women

Note: Only athletes with at least 4 non-team races last season and 16 non-team races this winter are included in the tables below. Shooting Efficiency is an overall shooting score, combining shooting accuracy and shooting time. It is the theoretical average time an athlete loses through shooting (based on hit rate, range time and potential penalty loops). For more details, see here.


Men

Lukas Hofer improved his non-team hit rate by 7.1% and managed his quickest shooting times (avg. 29.1s) since the 2009โ€“10 season โ€“ which makes him the most improved among regular starters in the men’s field. The overall most efficient shooter, Simon Eder, also improved significantly over last season: he set his career best hit rate (93.3%) and his average theoretical time loss of 1:48.9 is the fastest ever for this Shooting Efficiency score.

If you have been wondering why Johannes Thingnes Bรธ had to fight so hard to defend his title (despite being close to his best ever ski speed), this stat gives the answer: in a sprint he loses the time equivalent of almost an entire additional penalty loop (roughly 2 penalty loops in pursuits/mass starts) compared to last winter (-6.9% hit rate). Sturla Holm Lรฆgreid was the overall 2nd best shooter, thanks to outstanding hit rate (92.6%) and great range times (46.8s). Interestingly, Lรฆgreid’s range time is faster than Eder’s, even though Eder’s shooting time is 0.6s better; apparently Lรฆgreid’s shooting preparation is close to one second quicker.

Changes in Shooting Efficiency | 2019โ€“20 vs. 2020โ€“21

NoFamily NameGiven NameNationRacesHit RateRange TimePenalty LoopTime Loss
Sprint
Change
NoFamily NameGiven NameNationRacesHit RateRange TimePenalty LoopTime Loss
Sprint
Change
1HoferLukasITA
2684.2948.820.22:09.3-20.2
2SimaMichalSVK
1684.0950.422.92:17.1-17.9
3PonsiluomaMartinSWE
2679.5247.521.62:19.3-16.1
4SamuelssonSebastianSWE
2687.1449.521.22:06.2-14.3
5EderSimonAUT
2693.3347.022.31:48.9-12.1
6GowChristianCAN
2187.5048.422.02:04.3-12.0
7WegerBenjaminSUI
2486.8450.222.32:09.7-10.9
8LesserErikGER
2386.9448.122.02:04.8-9.9
9NordgrenLeifUSA
1785.4250.323.12:14.2-9.5
10GowScottCAN
1982.8646.823.02:12.9-9.4
11EliseevMatveyRUS
2589.0046.722.11:57.7-9.4
12LatypovEduardRUS
2582.7550.621.82:18.9-9.3
13RastorgujevsAndrejsLAT
1980.3350.521.42:23.2-5.9
14DovzanMihaSLO
2088.0046.022.91:59.5-5.6
15VarabeiMaksimBLR
2078.3354.822.42:38.3-4.9
16HarjulaTuomasFIN
1786.9650.422.22:09.7-3.9
17KrcmarMichalCZE
2086.5650.321.72:09.7-3.9
18FemlingPeppeSWE
2182.8147.822.82:14.9-3.5
19LeitnerFelixAUT
2385.0053.122.22:19.5-2.6
20LangerThierryBEL
1881.1553.922.82:30.6-2.0
21FakJakovSLO
2690.7147.921.71:55.9-1.8
22SeppalaTeroFIN
2179.6951.121.62:26.2-1.0
23IlievVladimirBUL
1775.6051.022.02:35.5-0.8
24WindischDominikITA
1976.5550.121.12:29.6-0.6
25ClaudeFabienFRA
2579.0048.421.32:21.5-0.0
26BocharnikovSergeyBLR
2282.9450.824.32:23.0+0.1
27KomatzDavidAUT
2290.5953.921.72:08.2+0.7
28ClaudeFlorentBEL
1985.3654.022.22:20.5+0.8
29DohertySeanUSA
1982.1449.322.22:18.3+1.1
30DollBenediktGER
2681.4348.321.92:17.1+1.4
31Fillon MailletQuentinFRA
2587.2546.622.92:02.5+1.7
32JacquelinEmilienFRA
2687.3846.921.12:00.4+2.2
33BoeTarjeiNOR
2685.7149.920.32:08.8+2.3
34StroliaVytautasLTU
1678.1853.122.72:35.6+2.8
35PeifferArndGER
2187.9448.721.42:03.1+3.1
36BormoliniThomasITA
1884.0749.722.12:14.5+3.2
37PrymaArtemUKR
1982.8648.223.12:16.0+3.5
38DesthieuxSimonFRA
2685.2447.821.42:07.1+3.6
39DombrovskiKarolLTU
1786.2553.423.12:18.5+3.8
40ChristiansenVetle SjaastadNOR
2286.0050.421.12:10.4+4.4
41DaleJohannesNOR
2683.8152.021.62:18.9+4.7
42GaranichevEvgeniyRUS
1886.5549.823.42:11.2+4.8
43SmolskiAntonBLR
2280.5950.822.22:24.6+5.1
44LaegreidSturla HolmNOR
2692.6246.821.21:49.2+5.3
45GuigonnatAntoninFRA
2581.7549.121.92:18.2+6.6
46MoravecOndrejCZE
1886.0748.722.62:08.8+9.5
47PidruchnyiDmytroUKR
2280.5947.022.82:18.2+10.6
48TrsanRokSLO
1885.1947.823.32:10.2+11.5
49LoginovAlexanderRUS
2486.3249.022.42:08.6+12.0
50NelinJesperSWE
2374.0552.021.72:40.4+13.0
51BrownJakeUSA
1776.0055.030.53:03.1+14.0
52FinelloJeremySUI
1970.3650.422.22:46.6+14.2
53StvrteckyJakubCZE
1971.4356.221.72:54.5+15.1
54KuehnJohannesGER
1675.0053.921.22:40.7+15.2
55BoeJohannes T.NOR
2685.2448.821.12:08.7+18.2


Women

Janina Hettich was the most improved shooter on the women’s side. In her 9 races in 2019โ€“20, she had only managed to hit 70.9% of her targets โ€“ she was 17.7% better this winter. Dzinara Alimbekava wasn’t just the most improved skier, she was also the 2nd-best in terms of shooting improvements (further highlighting her incredible breakout year). Karoline Offigstad Knotten and Dorothea Wierer were the overall most efficient female shooters; they did however lose roughly 20s more on the range compared to Eder/Lรฆgreid (maybe 4-5s of that is down to skiing, the rest is due to slower and less accurate shooting).

Overall World Cup winner, Tiril Eckhoff, improved her shooting somewhat, thanks to a slightly higher hit rate (+1.4%) and a lower shooting time (-1.8s). In general, Eckhoffโ€™s performance stats, in terms of neither skiing nor shooting, improved dramatically; however, her Overall Performance Score nudged 0.1 higher (even with two horrendous races at the season opener). Hanna ร–berg‘s shooting closely followed her skiing form: she was the top shooter in trimester 1 (90.0% hit rate), but it completely fell apart by the end of the season (trimester 3 hit rate: 70.9%).

Changes in Shooting Efficiency | 2019โ€“20 vs. 2020โ€“21

NoFamily NameGiven NameNationRacesHit RateRange TimePenalty LoopTime Loss
Sprint
Change
NoFamily NameGiven NameNationRacesHit RateRange TimePenalty LoopTime Loss
Sprint
Change
1HettichJaninaGER
2488.6154.525.22:17.8-38.9
2AlimbekavaDzinaraBLR
2683.8153.025.12:26.7-28.1
3HaeckiLenaSUI
2179.6947.425.42:26.5-20.1
4MinkkinenSuviFIN
1883.8551.225.92:24.2-15.4
5ZdoucDunjaAUT
2588.7553.524.22:14.2-15.2
6ZukKamilaPOL
1777.2057.225.02:51.5-14.2
7MironovaSvetlanaRUS
2277.9451.223.92:35.1-13.7
8OebergElviraSWE
2582.2550.924.72:25.7-13.5
9HammerschmidtMarenGER
1786.9249.525.92:12.9-13.4
10KnottenKaroline O.NOR
2389.1750.325.72:08.4-13.3
11DavidovaMarketaCZE
2582.7554.023.82:29.1-11.8
12DunkleeSusanUSA
1979.6453.426.32:40.2-9.7
13HinzVanessaGER
2287.0653.324.92:18.8-8.0
14TachizakiFuyukoJPN
1882.3156.725.62:38.8-7.9
15KruchinkinaElenaBLR
2377.2258.825.22:55.0-7.1
16EderMariFIN
1777.0858.824.82:54.3-6.7
17EckhoffTirilNOR
2684.5251.023.02:17.6-6.5
18HerrmannDeniseGER
2581.5052.624.12:29.7-6.3
19SchwaigerJuliaAUT
1984.6454.625.22:27.9-6.1
20LunderEmmaCAN
2285.8849.824.92:14.7-5.0
21Braisaz-BouchetJustineFRA
2676.6753.623.32:41.7-4.1
22CadurischIreneSUI
1679.5748.324.82:27.3-3.9
23GasparinSelinaSUI
1977.5054.623.62:42.2-3.8
24WiererDorotheaITA
2686.9049.023.92:09.3-3.7
25PidhrushnaOlenaUKR
1882.9653.126.02:30.3-3.0
26BrorssonMonaSWE
2284.4153.724.92:26.4-2.0
27DzhimaYuliiaUKR
2186.5652.024.82:17.4-1.9
28Hojnisz-StaregaMonikaPOL
1687.2052.924.62:17.3-1.7
29KuklinaLarisaRUS
1684.0049.424.92:18.7-0.7
30GasparinElisaSUI
2180.9452.024.92:31.4+0.2
31SolaHannaBLR
2370.2749.924.22:51.7+0.2
32PuskarcikovaEvaCZE
1882.6950.426.22:26.1+0.8
33TalihaermJohannaEST
1880.7756.926.12:43.9+1.3
34PerssonLinnSWE
2683.8153.123.92:24.9+2.1
35RoeiselandMarte OlsbuNOR
2685.0050.524.22:17.3+2.1
36TandrevoldIngrid L.NOR
2583.0854.824.12:30.4+2.5
37HauserLisa TheresaAUT
2685.0050.923.02:16.4+4.9
38BescondAnaisFRA
2683.1056.624.22:34.0+5.1
39MaedaSariJPN
1671.8256.625.73:05.8+6.3
40OebergHannaSWE
2684.5248.224.22:13.8+6.7
41GasparinAitaSUI
1983.5751.025.92:24.6+7.3
42VittozziLisaITA
2578.0051.524.42:36.8+8.4
43JislovaJessicaCZE
1777.0856.325.32:50.5+8.8
44EganClareUSA
2381.6757.724.32:40.0+8.9
45PreussFranziskaGER
2686.4350.523.42:12.7+9.7
46SimonJuliaFRA
2675.5048.024.52:36.0+11.0
47BendikaBaibaLAT
1676.6750.524.82:39.0+11.1
48TodorovaMilenaBUL
1976.9056.424.82:50.0+12.2
49CharvatovaLucieCZE
1765.9151.623.13:02.1+12.4
50LieLotteBEL
1890.0055.226.22:16.7+13.5
51BlashkoDaryaUKR
2087.7452.725.02:16.1+14.3
52ChevalierChloeFRA
1878.1557.724.32:48.4+16.3
53InnerhoferKatharinaAUT
1766.6754.424.13:09.2+22.9

Posted in Statistical analysis | Tagged shooting

Wierer in pursuit… of my mind

Posted on 2021-03-28 | by biathlonanalytics | Leave a Comment on Wierer in pursuit… of my mind

In early March I wrote a piece about Wierer’s Pursuit efforts and results, and although I still stand by what I wrote it somehow felt incomplete. In the latest Extra Runde podcast, they brought up again that Wierer seems to do better when starting with a lower bib number in the Pursuit. It feels right, but I couldn’t find the data to support that for Wierer specifically. I did find that the later you start, the more places you can, and typically will, make up, but that applied to all athletes.

Then it struck me (yes, I’m a bit slow sometimes…) there was another way to measure performance in the Pursuit that could be helpful. Look at the Isolated Pursuit time, or in other words the “race time” – “seconds behind at start”. You can also call it the actual race time, and it’s a simple calculation: Total Time – Start Info. The latter has the time an athlete started behind Bib nr. one, the winner of the prior Spring race. Having this Isolated Pursuit time and the ranking of this time would show me her true performance of the day. Plotting that for the last three seasons gives me the following chart:

Now we can see if her start bib is higher her Isolated Race results vary between very good and very bad. Her races with a bib number higher than 15 though are all good to very good for the Isolated Race performance.

Values show change in ranking of isolated race result and start bib (positive = improvement)

If we only take her 8 Pursuit races in the 2020-2021 season we can see she had her best performances when starting lower than 5th and two of her three worst performances when starting 5th or higher. I think it’s fair to say, although based on a small sample size, that the guys from Extra Runde were correct in their assumption. Starting later in the Pursuit races brings up the better performances in Dorothea Wierer. Now they have some data to prove it.

Data from RealBiathlon.com, Feature image from Manzoni/IBU

Posted in Statistical analysis

Stina, look at what you made me do!

Posted on 2021-03-28 | by biathlonanalytics | Leave a Comment on Stina, look at what you made me do!

After watching the final season races in Oestersund, and one moment in one race specifically, I wanted to do further analysis into the time that athletes prepare themselves for shooting and for skiing after the shooting. And see if this would be even possible. But first, let me show you the moment that triggered this:

Stina Nilsson takes FOREVER to put her poles back on and get back to fully functioning skiing after her prone shoot in the Women’s Sprint race in Oestersund. It made me wonder if there is a way to analyze how fast or slow athletes are outside of the shooting while not skiing on the course. Taking poles and rifle off, getting in position, getting the rifle and poles back on and getting skiing again.

Data

The data I hope we can use for this is the Range time and the Shooting Time. As I’m interested in the time on the Range but while not shooting, it’s a simple subtraction: Range time – Shooting time = Prep time. So Prep time is the time spent in the Range while not shooting. That would be the time described above, getting off the poles and rifle, getting ready, and then getting moving again.

The only problem is that there are athletes like Stina Nilsson that take so long to get the poles back on that they already have left the range. Now I’m sure this happens more often (especially for those athletes shooting in the lane closest to the penalty zone at end of the range) but I don’t recall ever seeing an athlete going past the time recording and still having to start putting on the second pole!

Can we use this data then?

Ironically when I look at Stina’s race data, her Range time rank is 57th (103.1 sec.) and her Shooting time rank is 70th (62.3 sec.). But she does have the fastest Prep time of the whole race. We know that a) her prep goes well beyond the range, and b) there is logic in that the more time you spend shooting while in the range, the less time you have for Prep while in the Range. Considering this, the Range and Shooting time are not able to answer who is faster and slower at “prepping”, and I don’t think there is data available that can actually answer this question.

Alternative insights perhaps?

What is still interesting though is to look at how much of the Range time is used for shooting. At least that will tell something about the time spent not shooting while in the Range. In this specific race, it varied from 33% to 53% of Range time, which tells you there is still a lot of time to be gained by either skiing / gliding a bit faster in the range before the shooting, getting in position faster, and getting up and going after the shooting.

Phases

Another fact we cannot get from the data is that the phases before and after the shooting are very different. The phase before shooting is focused on slowing down, reducing the heart rate and focussing on the shooting. In other words, this tends to be slow. The phase after the shooting is fast and all focussed on getting ready and on to the course to ski.

Depending on what lane the athlete shoots in, the distance spent in these two phases while inside the Range area differs significantly. This also means we cannot look at these data for one race and draw any conclusions. For all races in three seasons, however, this should even out to some degree, although I would expect that the top athletes who shoot in the last lanes most of the time spend more time in the slow phase while in the Range area.

Alternative insights perhaps? – Part II

Sticking with the women’s field but including all races since the 2018-2019 season, we now see the average percentage of Range time spent shooting varies from 45% to 70%. Or 30% to 55% spent not shooting. Let’s check that assumption that higher-ranked athletes would be slower because they relatively spend more time in the slow phase due to their shooting lane. first I look at the average rank and average time spent shooting per athlete:

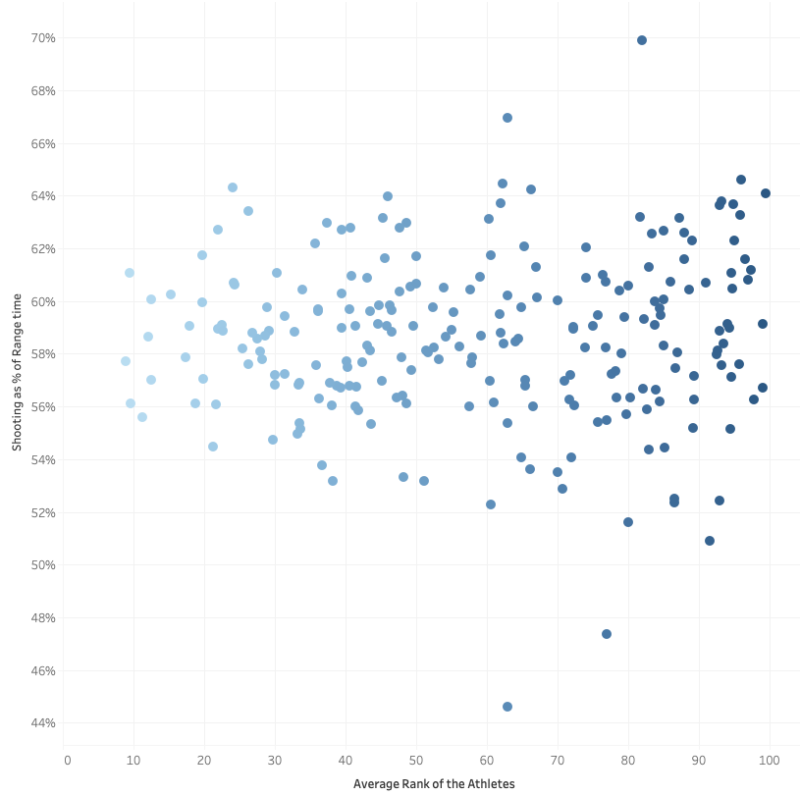
This only shows us that as the Ranks get higher there is more variability between the athletes. How about the same but per athlete and race:

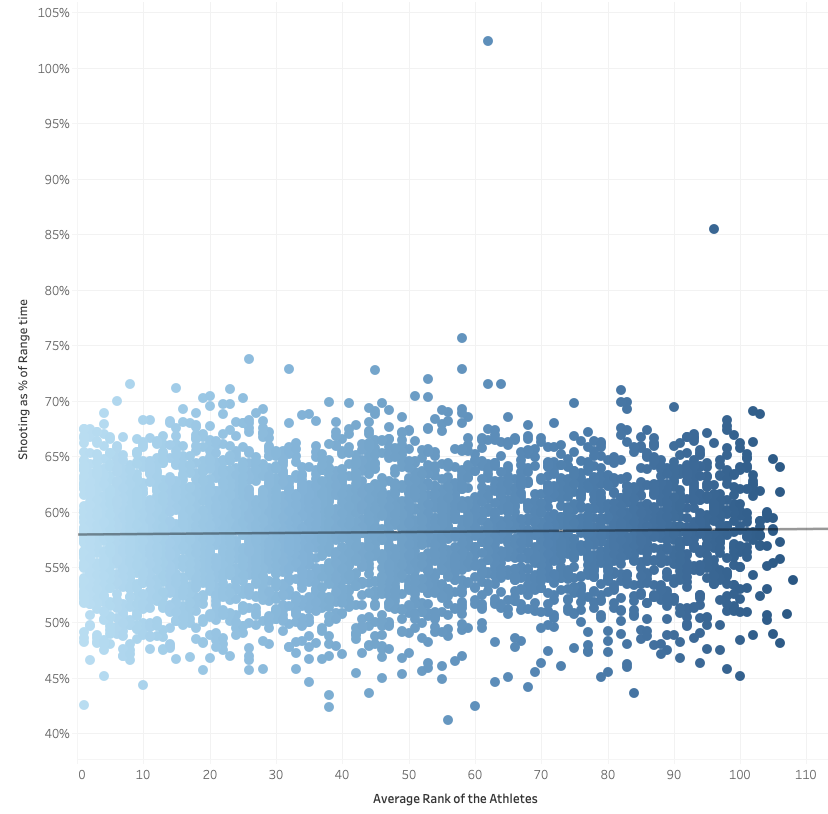
The trend line is barely statistically significant (p ~ 0.05%) but the R-square value tells me not much variation is explained by the model.

What ever it does and does not tell me, my question if higher ranked athletes are spending more time in the slow phase and thus slower in the time spent not shooting is not answered. On top of that, higher ranked athletes are generally speaking better shooters, both accuracy and speed, so that is another variable in the mix.

Conclusion

My sad conclusion is that based on the available data we cannot make any conclusions about how fast or slow athletes are prepping for shooting and then for skiing. If we would have data that starts from the moment the athletes prepares for shooting and continues until an athlete is in full skiing position, I don’t see how I can come to any conclusion on this topic. Perhaps I should rename this piece “Ramblings about Preparation time.” Nah. Hopefully, these ramblings will trigger something with readers and who knows where that may lead?

Posted in Statistical analysis

Posts navigation

Older posts
Newer posts

Recent Articles

  • Junior + U23 Development Index – Men
  • Junior + U23 Development Index – Women
  • The Path to GOAT Status
  • Most improved athletes this winter
  • New biathlon point system

Categories

  • Biathlon Media
  • Biathlon News
  • Long-term trends
  • Statistical analysis
  • Website updates

Archives by Month

  • 2024: J F M A M J J A S O N D
  • 2023: J F M A M J J A S O N D
  • 2022: J F M A M J J A S O N D
  • 2021: J F M A M J J A S O N D
  • 2020: J F M A M J J A S O N D
  • 2015: J F M A M J J A S O N D
  • 2013: J F M A M J J A S O N D
  • 2012: J F M A M J J A S O N D

Search Articles